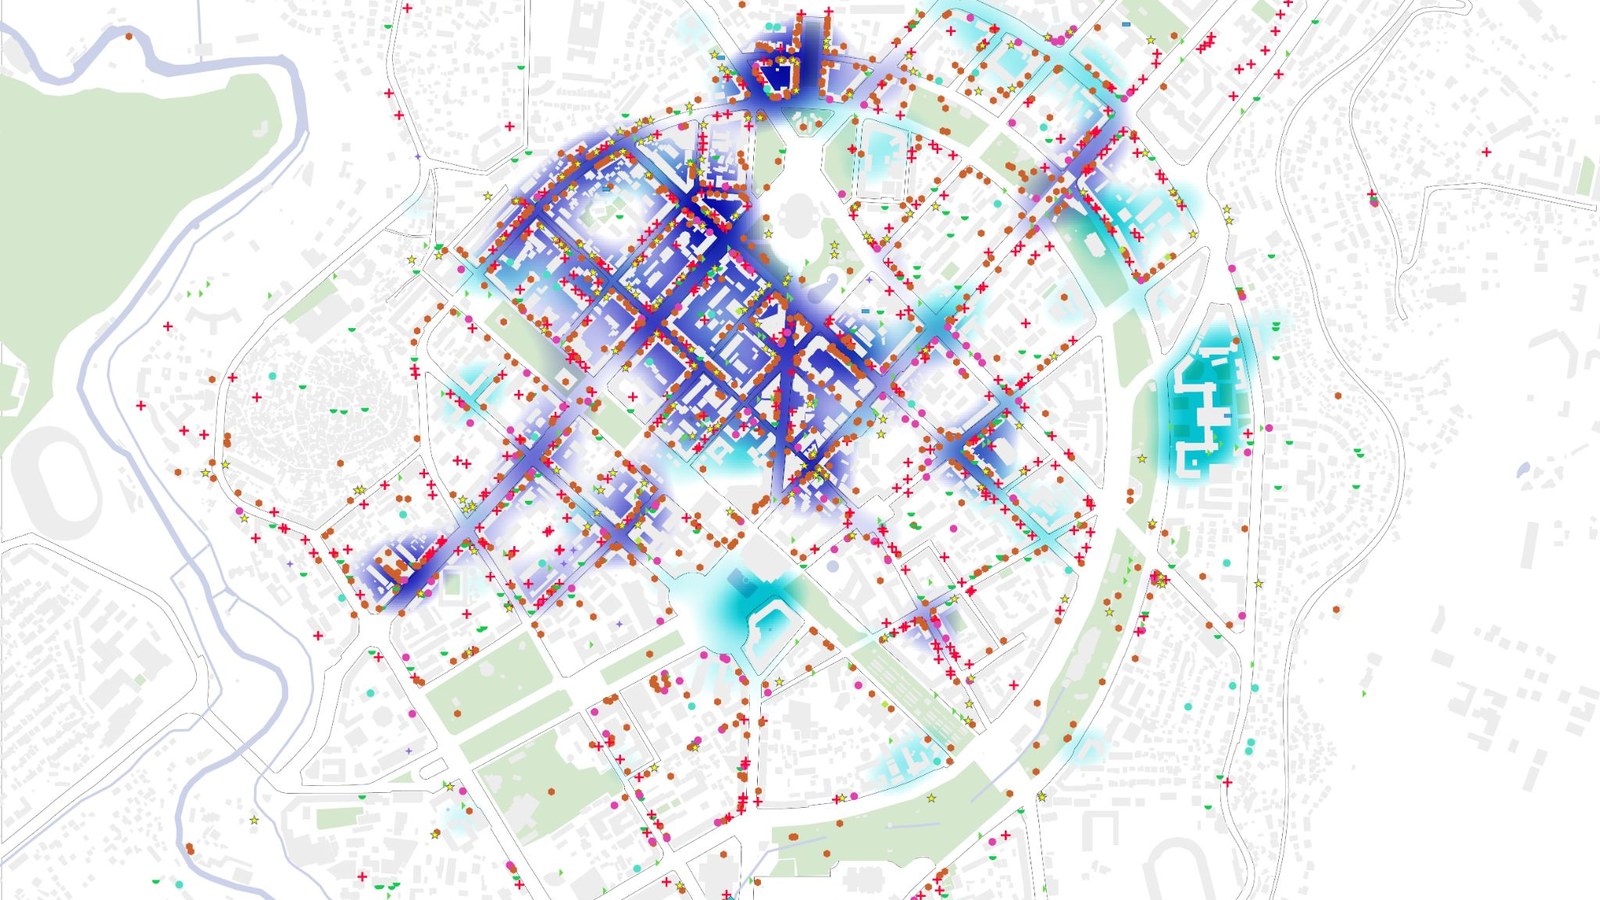
The amenity fabric of central Yerevan: every point of interest around the site, coloured by category, over the city's buildings and its garden-city ring.
An amenity-and-walkability portrait of central Yerevan. 3,146 points of interest classified, mapped, and turned into density surfaces to read the urban fabric the World Trade Center Yerevan would join.
The amenity fabric of central Yerevan: every point of interest around the site, coloured by category, over the city's buildings and its garden-city ring.
When SOM masterplanned the World Trade Center Yerevan, ORG took on the site and city analysis. Our responsibility was to understand the neighbourhood a new landmark would land in. Yerevan was laid out a century ago on a garden-city plan, and the brief was to understand what the modern fabric around the site actually offers today. What amenities are nearby, how densely they cluster, and what a person can reach on foot. I was able to build that using open-source geospatial data.
I pulled every point of interest around the site from OpenStreetMap and Overture (extracted March 2025) and classified 3,146 amenities into 17 categories: food and beverage, retail, healthcare, culture, transport, and more. From that base:
All of it in open-source Python: GeoPandas, SciPy and rasterio.
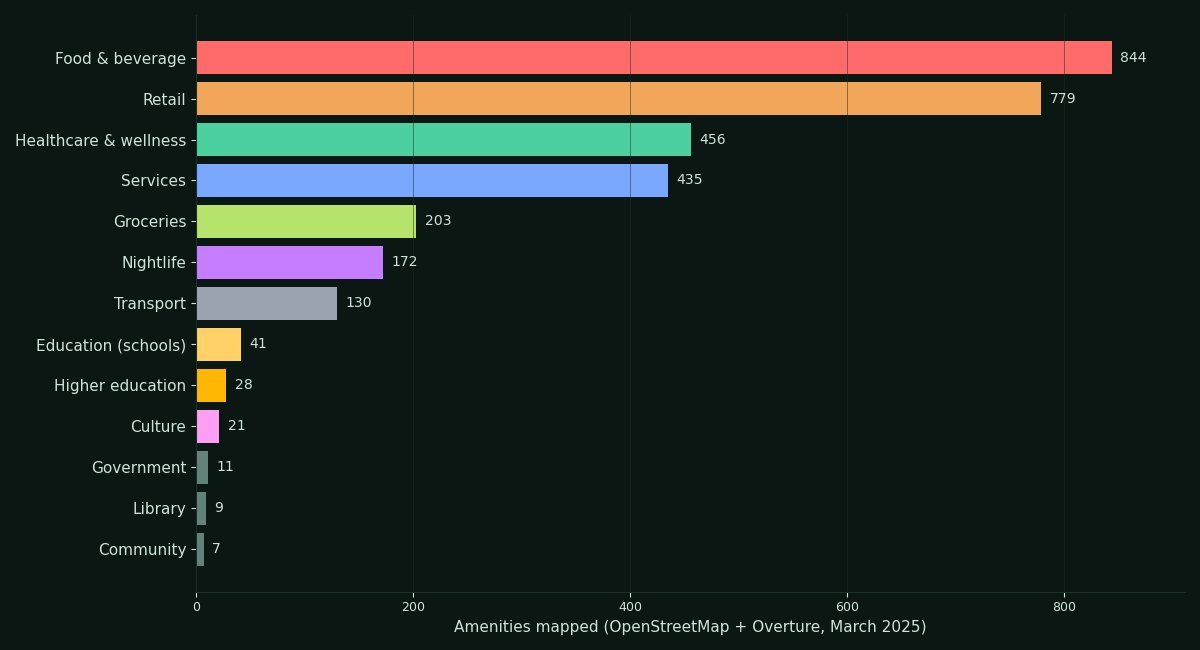
The amenity mix of central Yerevan: 3,146 points of interest by category. Food and beverage and retail dominate the fabric around the site.
Food and beverage (844) and retail (779) dominate the fabric, but the more useful finding is where each type lives. The density surfaces show that every category clusters differently, and cutting them by theme reveals a distinct urban structure. Higher education and tech services scattered in pockets across the centre, while design, culture, and retail concentrate hard along the main commercial spines.
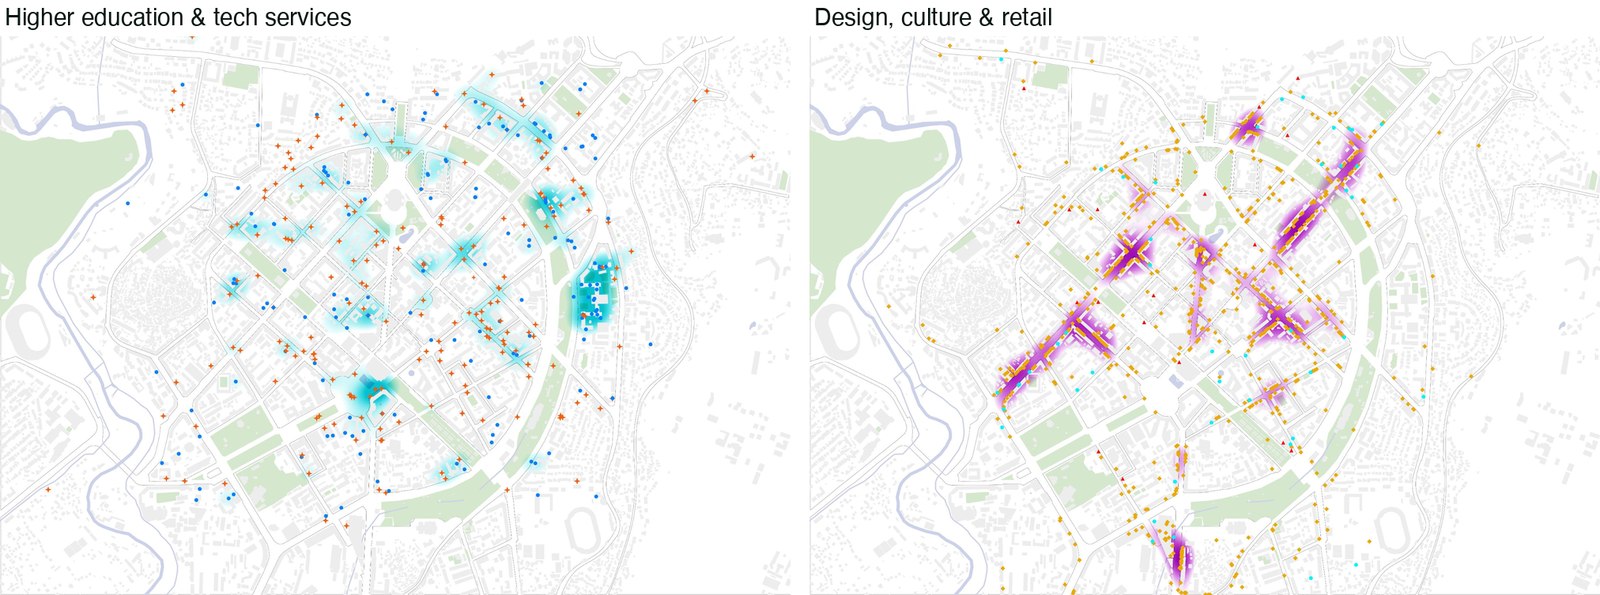
The same method cut by theme: higher education and tech services (left) against design, culture, and retail (right). Each concentrates in a different part of the city.
Accessibility ties it together. From the site, a large share of the city's key destinations (tech, culture, education, health, nature) sit within a short walk or drive, which is what lets the analysis speak to how the new landmark would connect into the existing city.
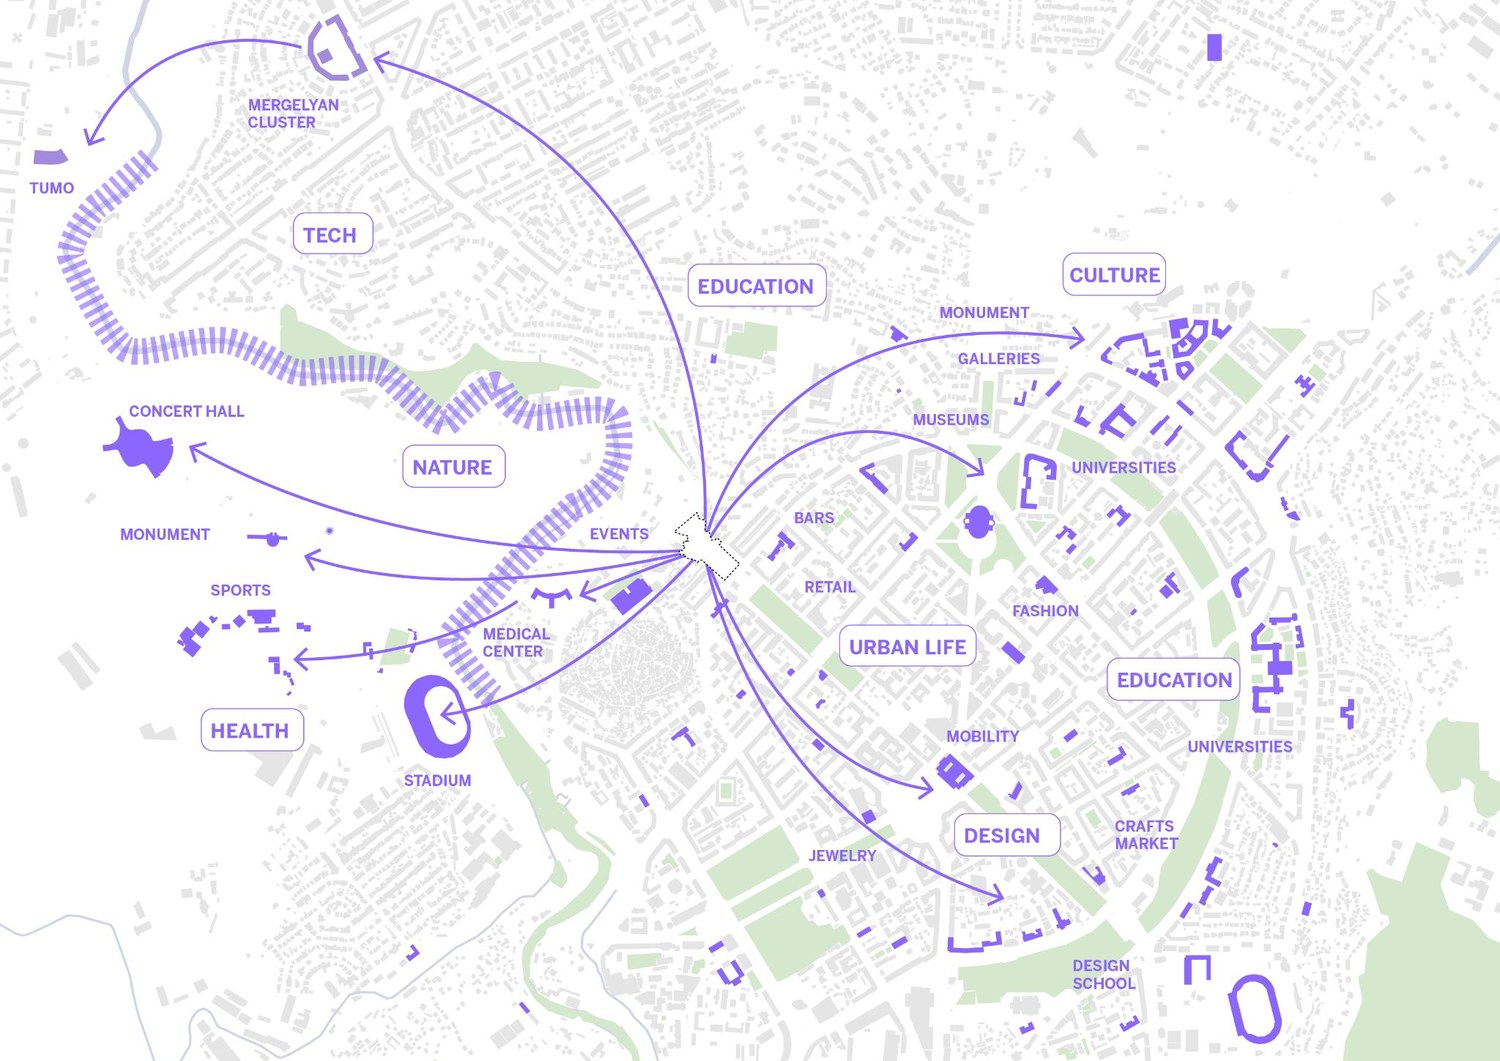
What the site reaches: walking and driving connections from the World Trade Center site out to Yerevan's key districts and destinations.
It is a compact, repeatable way to characterize an urban site from open data alone, the evidence layer beneath a masterplan's first moves.