01The idea
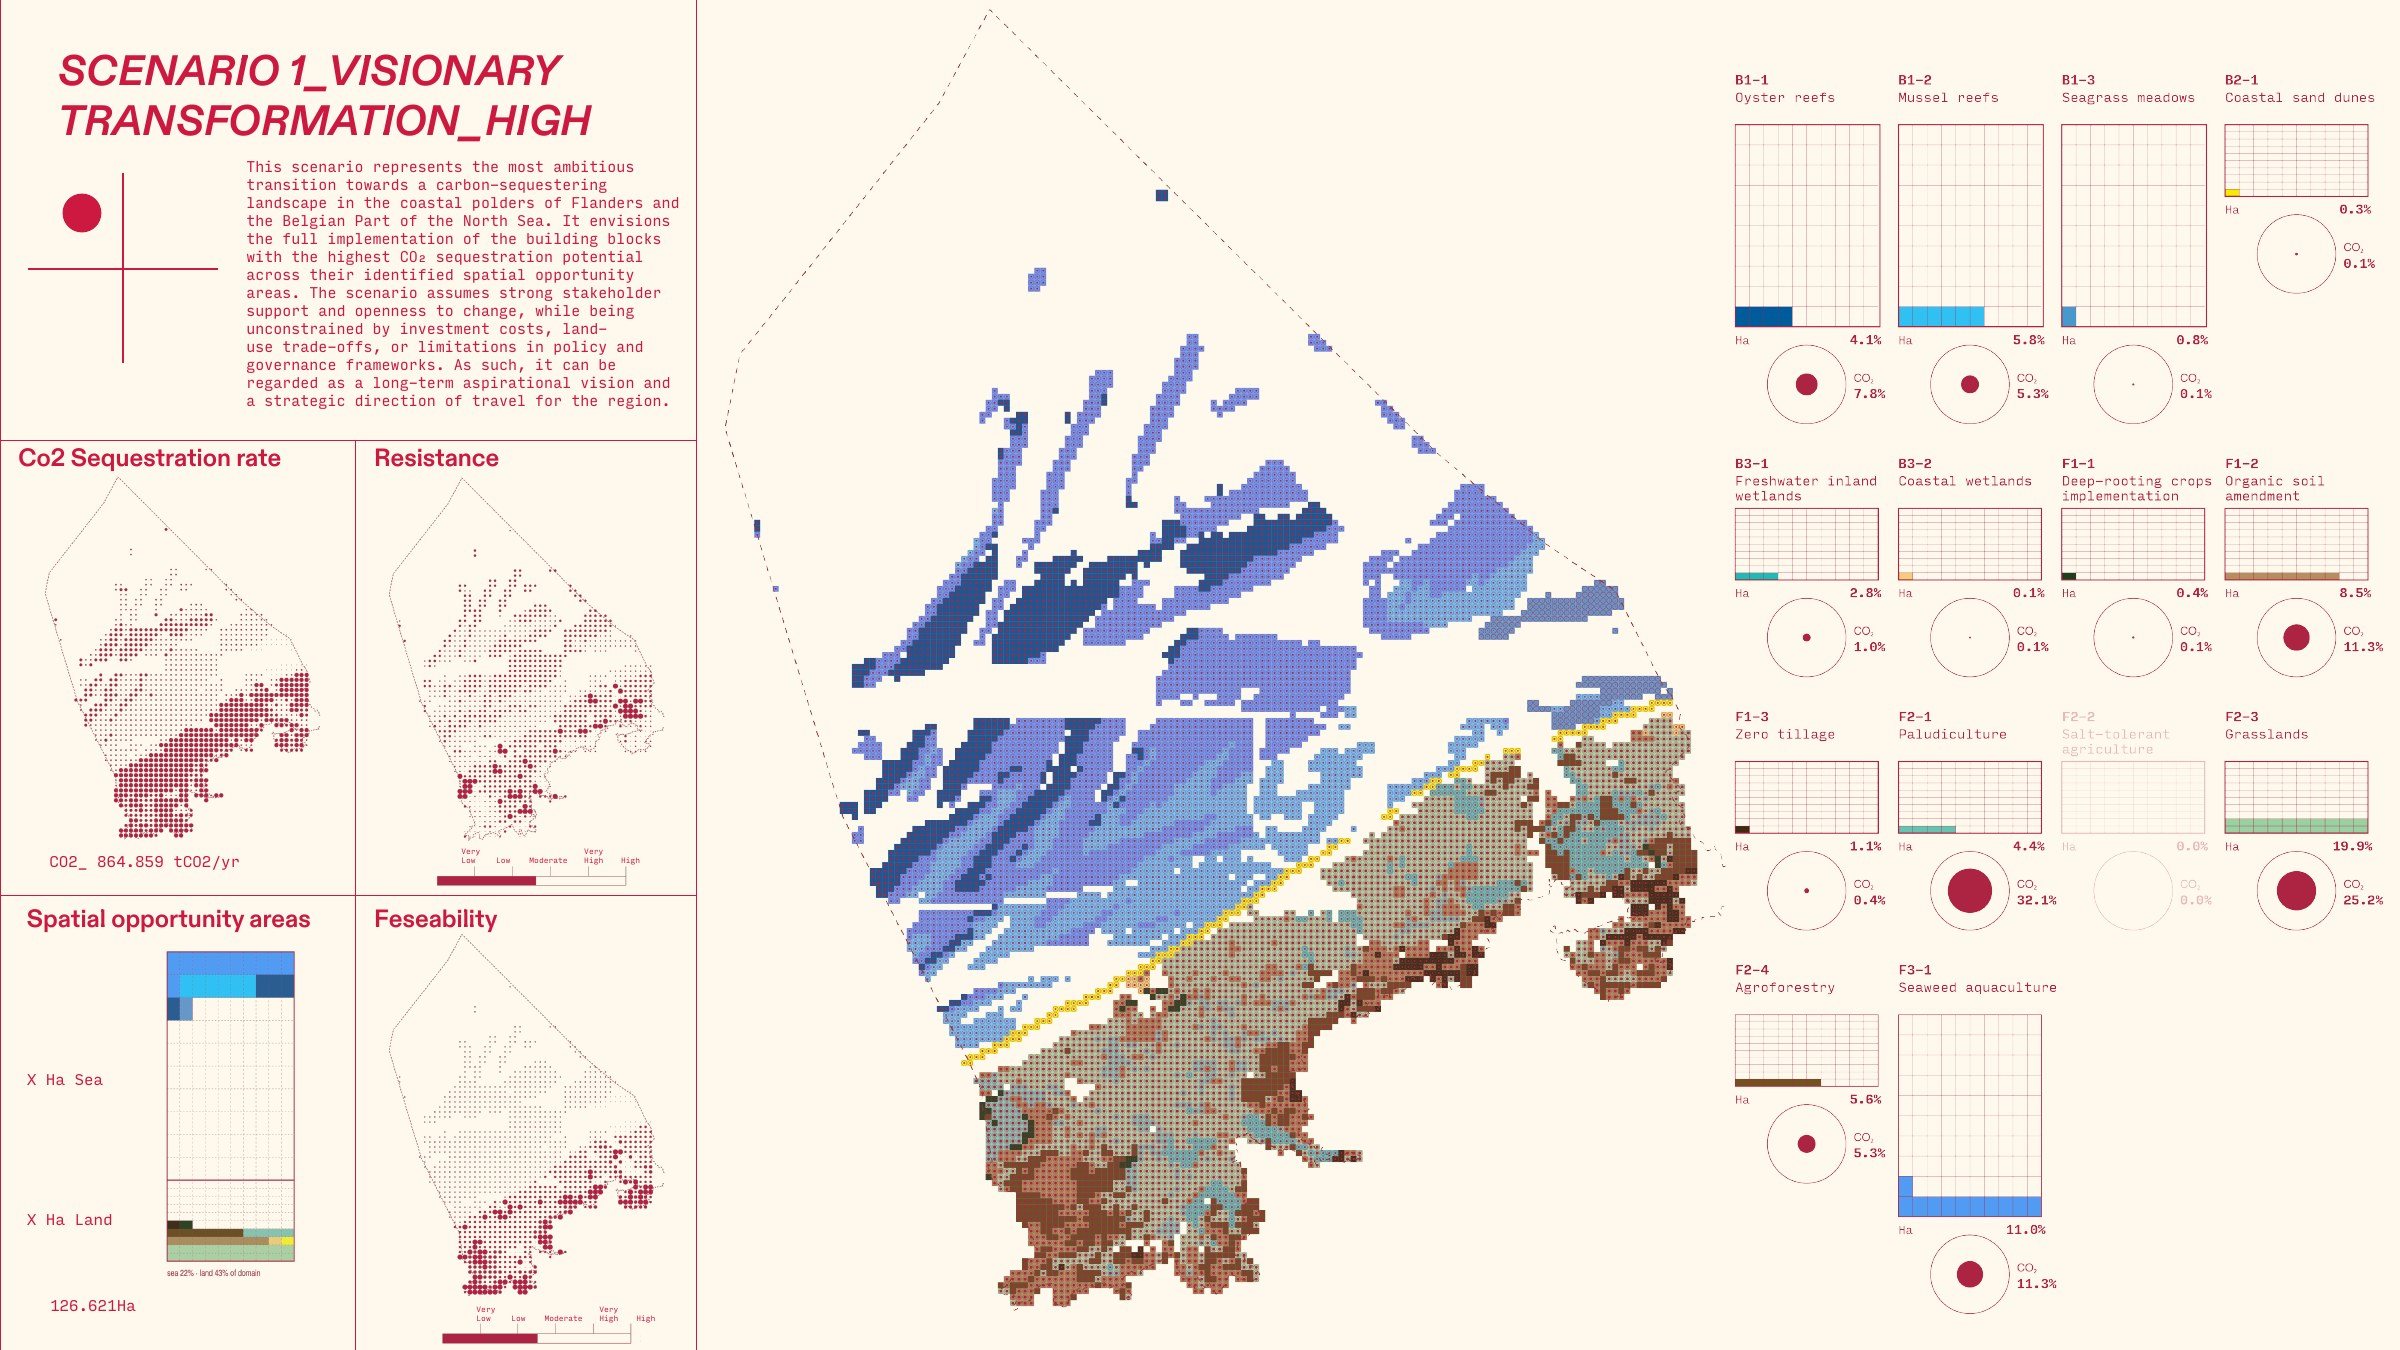
The Flemish coast is a narrow, intensely used strip where climate adaptation, agriculture, nature, and the sea all compete for the same ground. Nature-based solutions (restoring wetlands, farming shellfish, changing how cropland is worked) can pull carbon out of the atmosphere while doing other good along the way. The hard question is where. Every intervention only works in certain places, sequesters carbon at very different rates, and carries its own cost and resistance to being adopted.
This project gives a spatial representation of the solution. By mapping the best carbon return achievable at every location and then separating the theoretical potential from what could realistically be put in the ground, we can visualize and quantify various scenarios to learn the best way forward.
Map the best carbon return achievable at every location, then separate the theoretical potential from what can actually be implemented.
02The building blocks
The analysis is built on a library of fourteen "building blocks": discrete nature-based interventions spanning the whole coastal gradient:
- Marine: oyster and mussel reefs, seagrass meadows, macroalgae farming
- Coastal: sand dunes, freshwater and coastal wetlands, paludiculture, salt-tolerant agriculture
- Agricultural: agroforestry, deep-rooting crops, zero tillage, organic soil amendment, grasslands
Each block carries a CO₂ sequestration rate drawn from the literature as a low–high range (tonnes CO₂ per hectare per year), plus two implementation indices scored 1–5: resistance (how hard it is to get adopted) and economic feasibility. Sequestration alone spans two orders of magnitude, from seagrass at roughly 0.2 up to paludiculture at nearly 52 tCO₂/ha/yr, so where each block can go matters enormously.
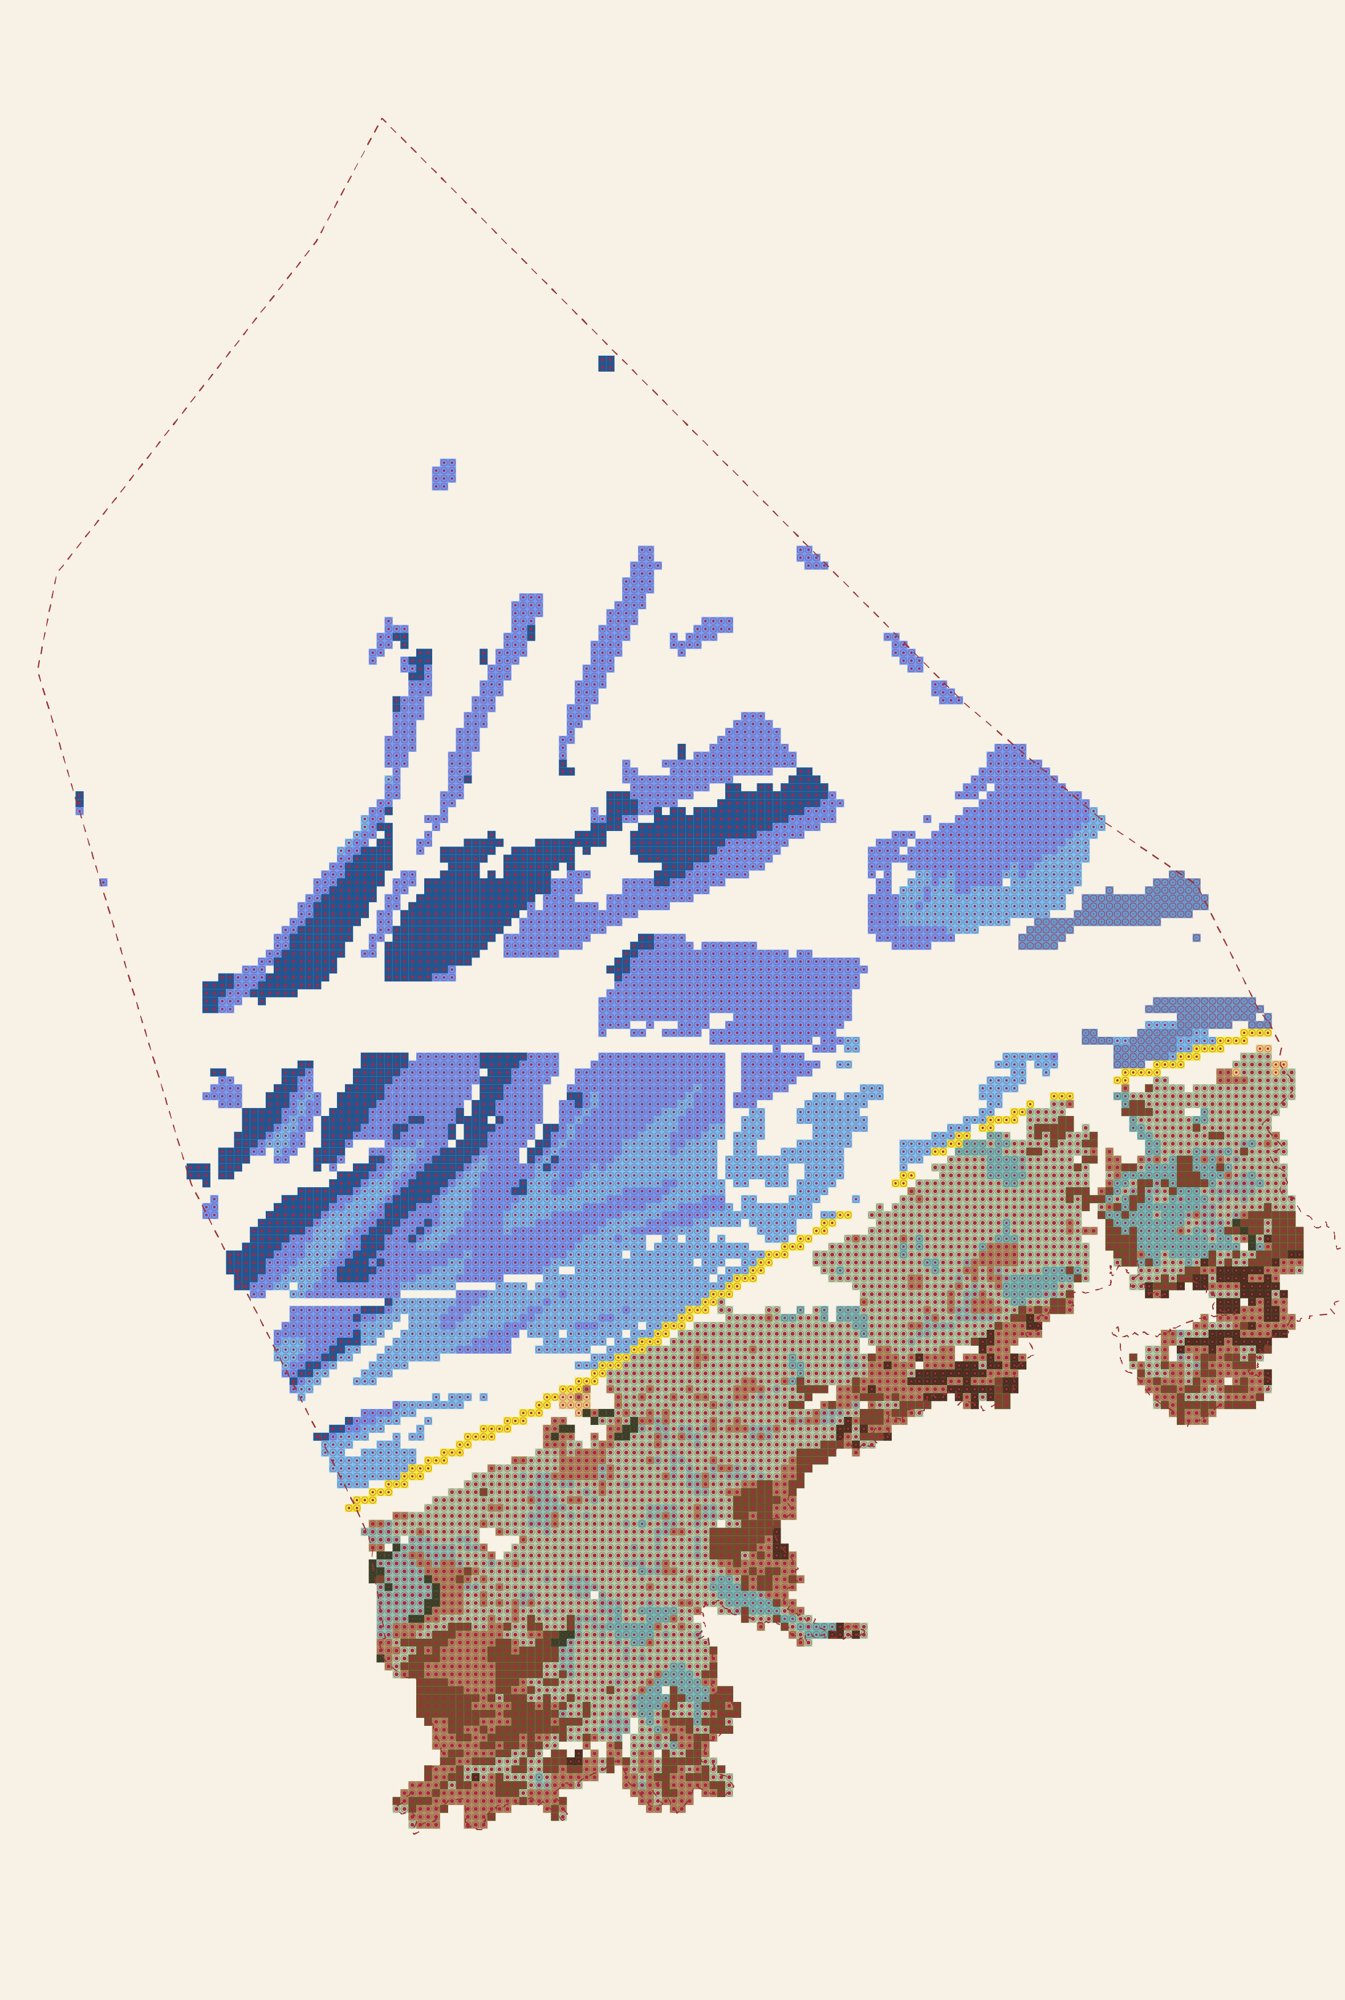
The fourteen building blocks placed across the whole coast: every cell takes the intervention that sequesters most there, the marine blocks offshore giving way to agricultural ones inland. Graphics: Caterina Dubini.
03The method
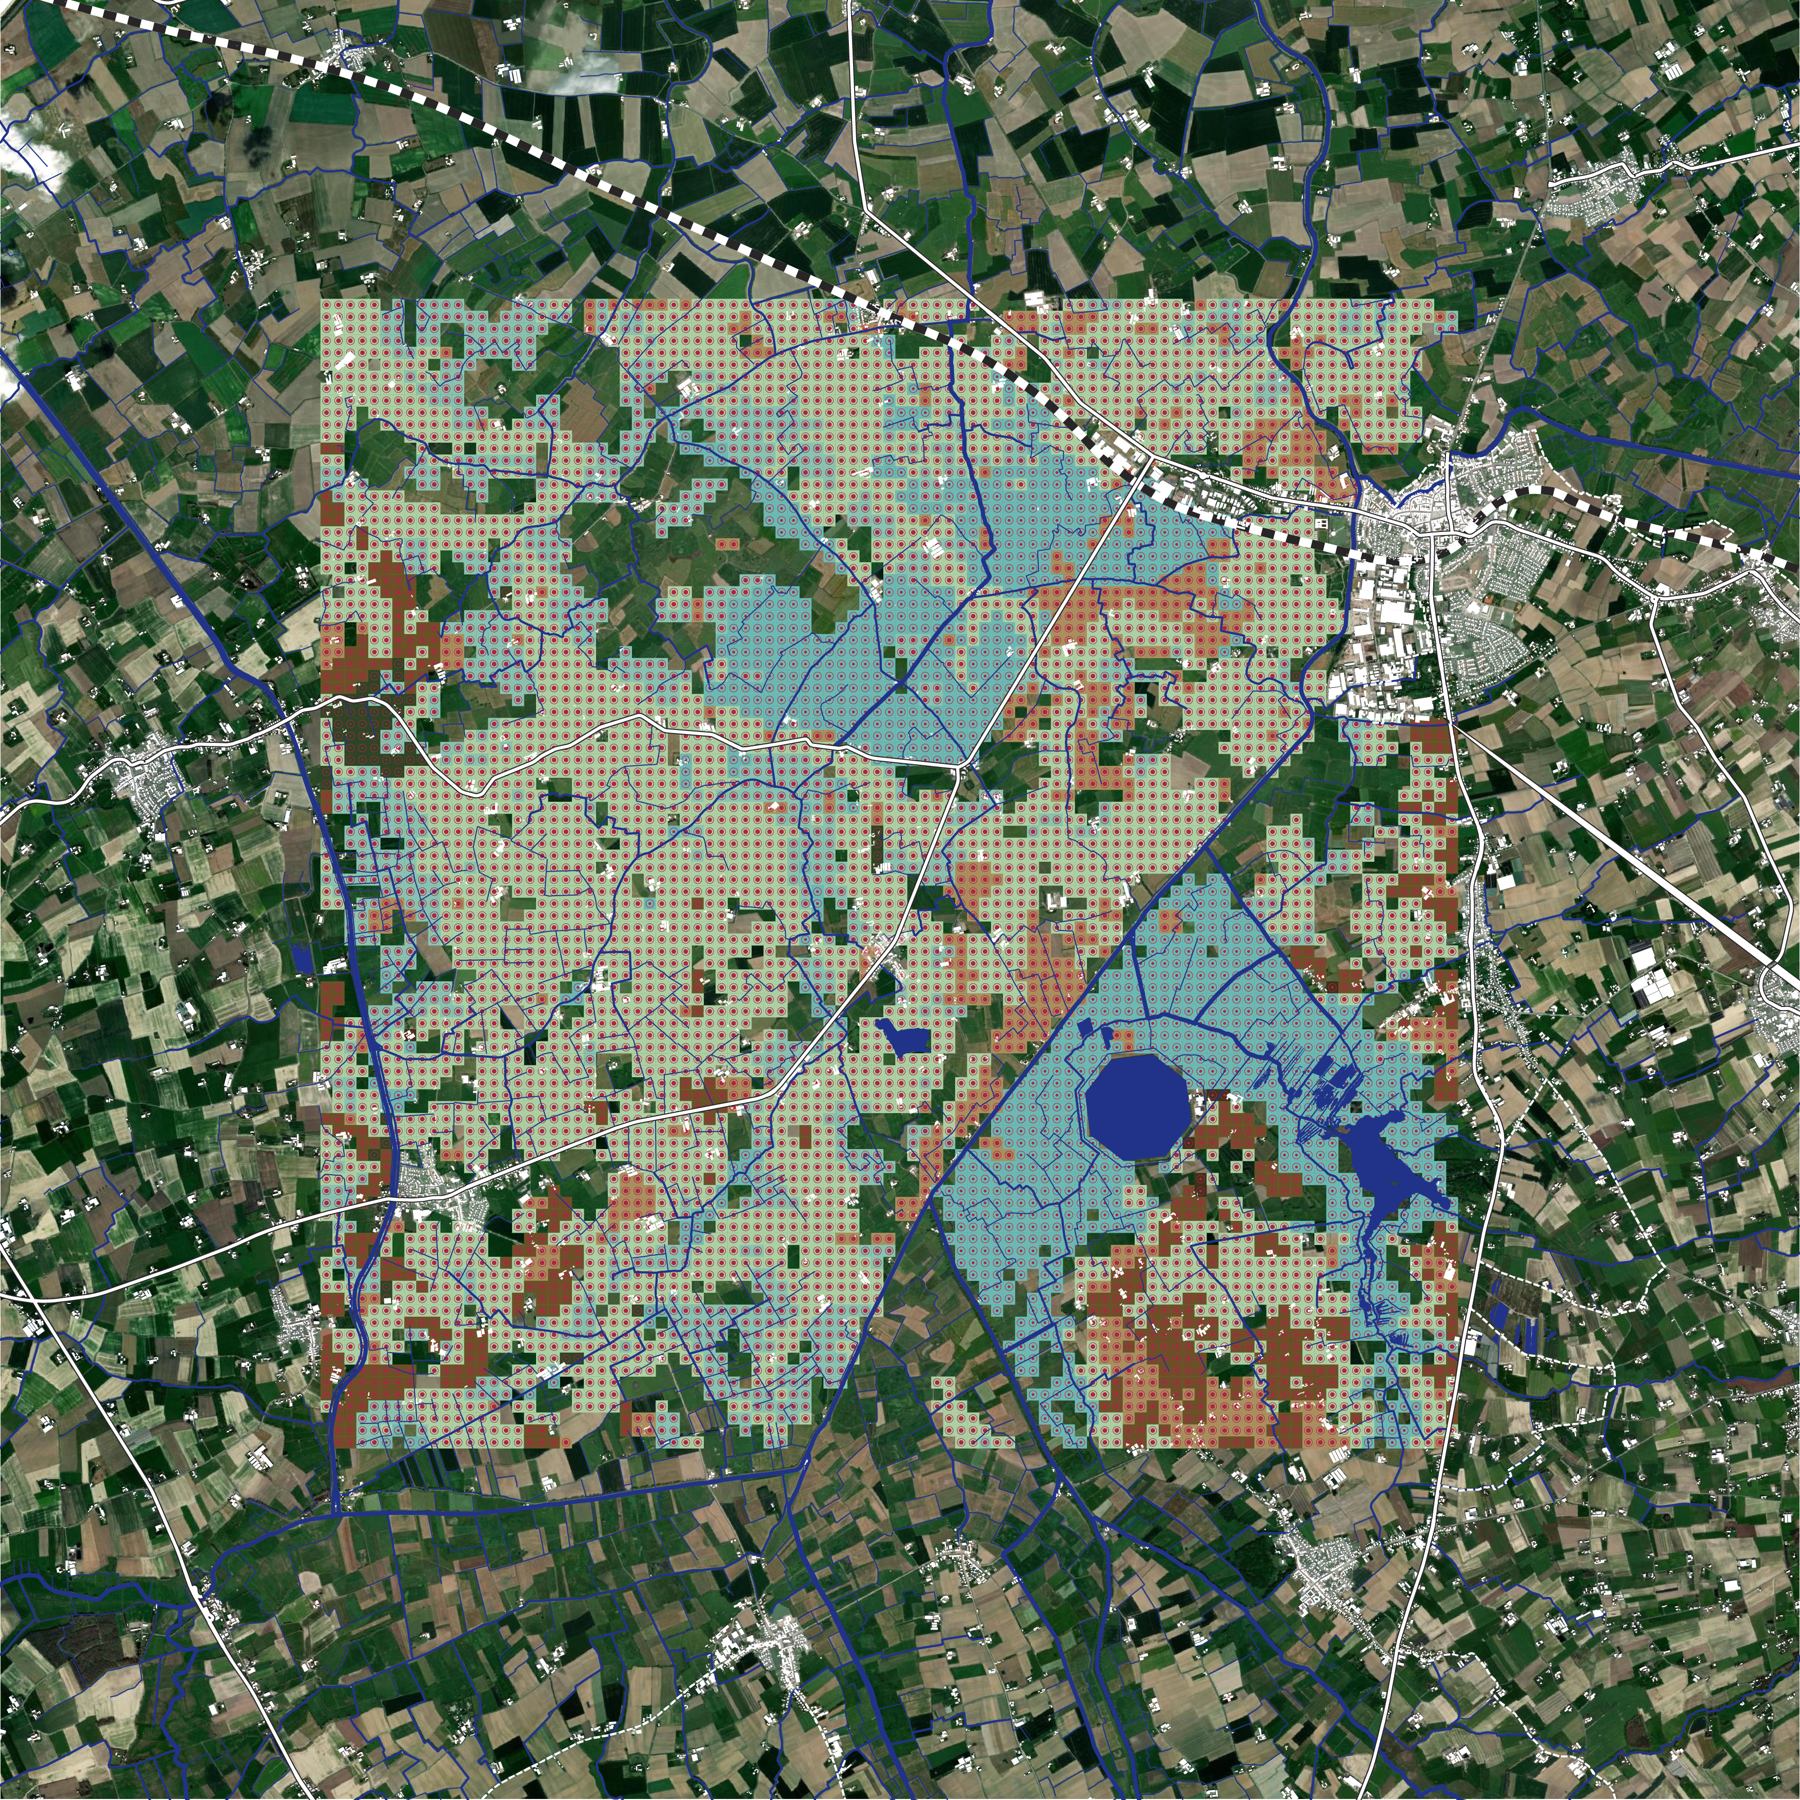
For every building block I rasterized its candidate area across the coast at 10-metre resolution (100 m² per pixel, in the Belgian Lambert projection). Stacking those layers gives, at each pixel, two answers: the best carbon rate achievable there, and which block achieves it. The result is a coast-wide map of maximum nature-based drawdown, one intervention per cell.
To make hundreds of thousands of pixels legible, the results aggregate into a grid of cells at several sizes, from 100 m up to 2 km. Each cell is coloured by its dominant building block and sized by its total sequestration, so a single map reads as what to do where, and how much it buys you.
The method on the ground: the 10-metre grid over the Ijzervallei, each cell taking the best-performing intervention for that pixel. Graphics: Caterina Dubini.
04The scenarios
A map of theoretical potential is not a plan. The final step filters the building blocks through their resistance and feasibility scores into four scenarios:
- All interventions: the full theoretical ceiling
- Low-resistance only: resistance ≤ 2
- High-feasibility only: feasibility ≥ 3
- Deployable: both at once: low resistance and high feasibility
Moving from the first scenario to the last strips the map back from everything that could sequester carbon to what could realistically be put in the ground: the version a coastal manager can actually act on.
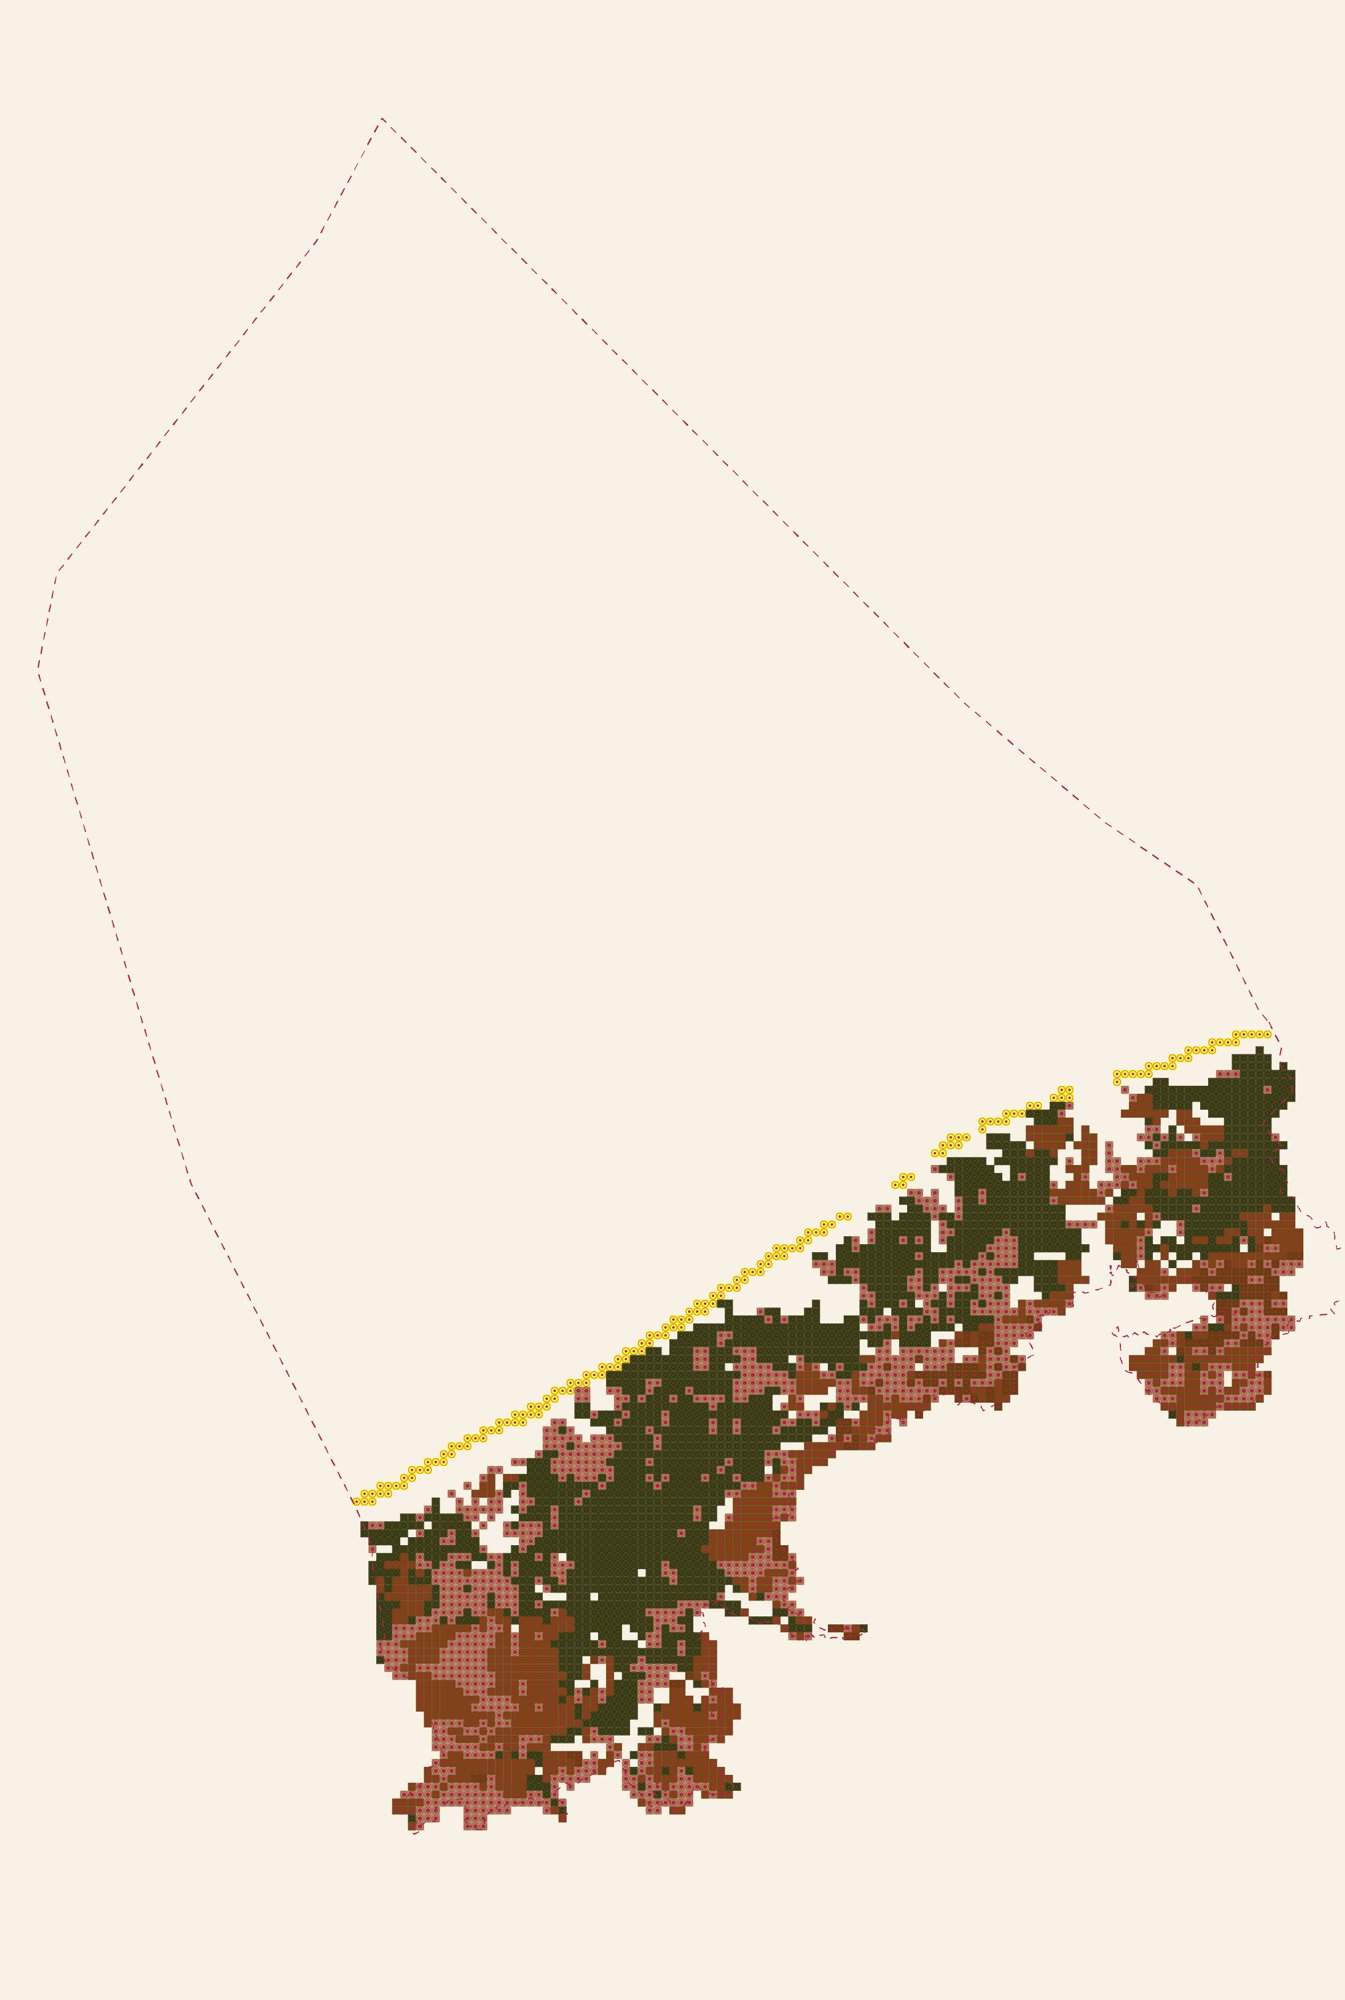
The pared-back end of the range: with marine and wetland blocks set aside, the coast falls back to what farmland can realistically deliver, with agroforestry and organic-soil measures carrying most of the drawdown. Graphics: Caterina Dubini.
05What it shows
The output is a coast-wide, decision-ready picture: where the big carbon wins sit (the wet, organic soils suited to paludiculture dominate wherever they occur), where marine interventions carry the sea, and how much of the theoretical potential survives once feasibility is taken into account. Rather than a single headline number, it hands planners a map they can interrogate, swapping scenarios to watch the trade-off between ambition and deployability appear directly in the grid.