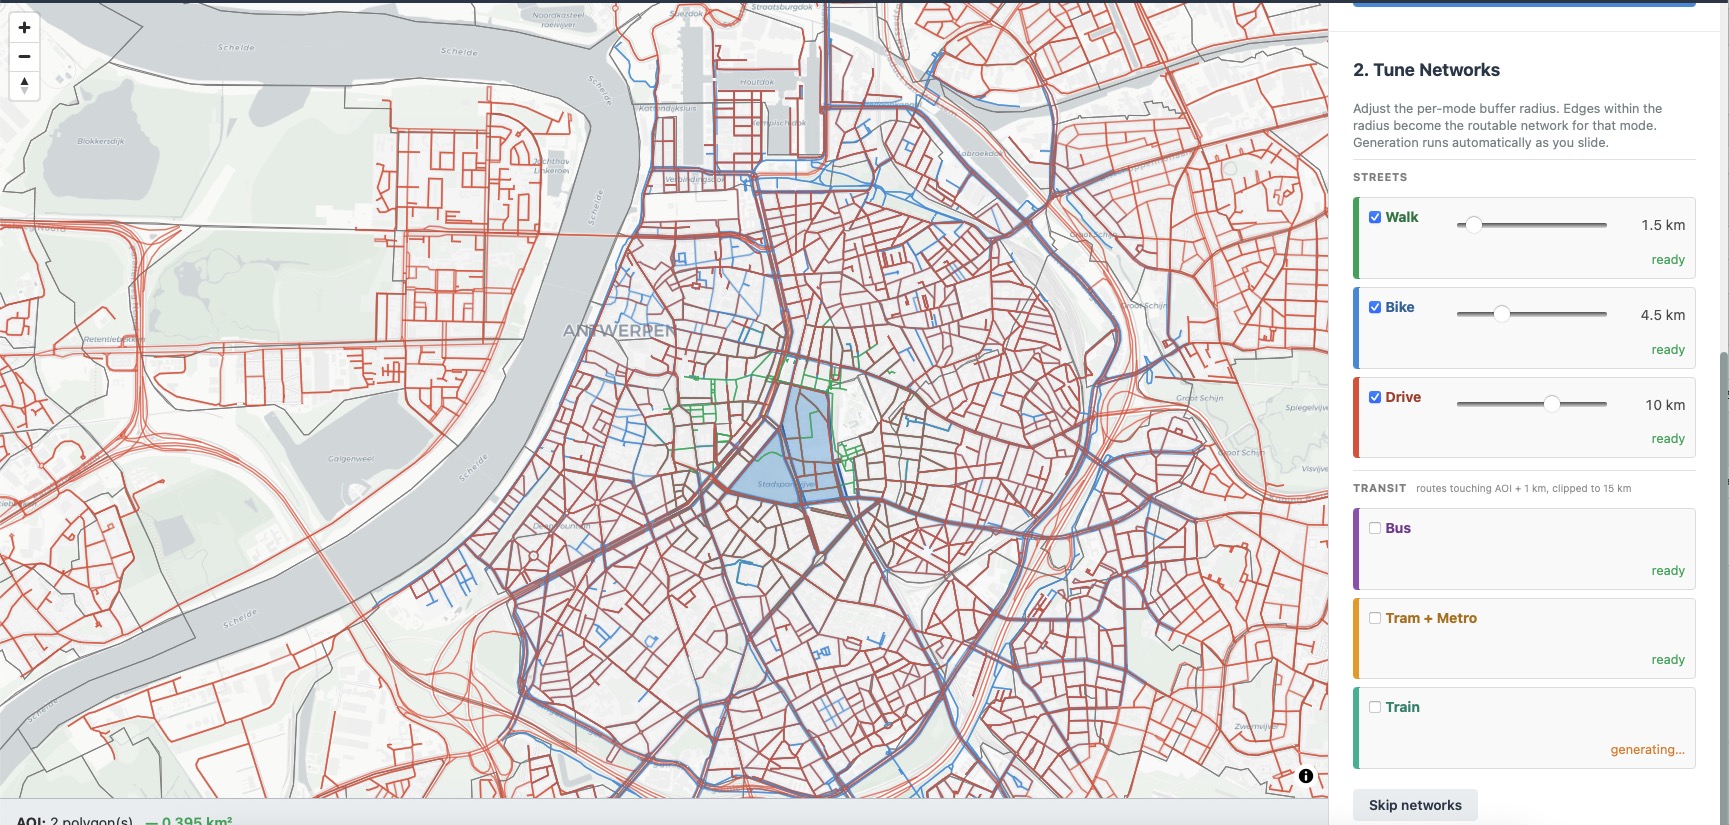
The multimodal network for a slice of Antwerp, walking, cycling, driving and transit generated together, cleaned and ready for routing.
A self-serve tool that turns the scattered mess of public open data into standardised, ready-to-use city blocks. Pick an area off the census map, choose the datasets you want, and it fetches, cleans and exports them to one schema. Built to work in any region, it runs today across Flanders, Brussels and New York from the same code.
The multimodal network for a slice of Antwerp, walking, cycling, driving and transit generated together, cleaned and ready for routing.
Every environmental or design study of an urban block needs the same foundation. Buildings, streets, parcels, trees, terrain, and population, all clean and aligned. In practice that data is scattered across dozens of public sources, each with its own format, projection, licence and quirks, and it all changes from one city or country to the next. Assembling it by hand for every new site is slow, error-prone and impossible to reproduce. That is the main purpose of this web-app.
The pipeline is built around a few firm rules to follow as it grows. One contract, a single data standard every export must match. One catalogue, holding every source's endpoint, licence and projection, so adding a source is a config entry rather than a code change. Three stages for new regions, raw then cleaned then human-reviewed, where the webapp only ever reads the reviewed layer. The result is a tool able to work in any region, adding a new place means adding catalogue entries rather than forking the main engine. The tool was designed from the start to work anywhere, and the regions live today are the ones we have needed so far.
On top of the pipeline I built a web front end so anyone can use it. First define the area through an AOI drawer or simply selecting census tracts.
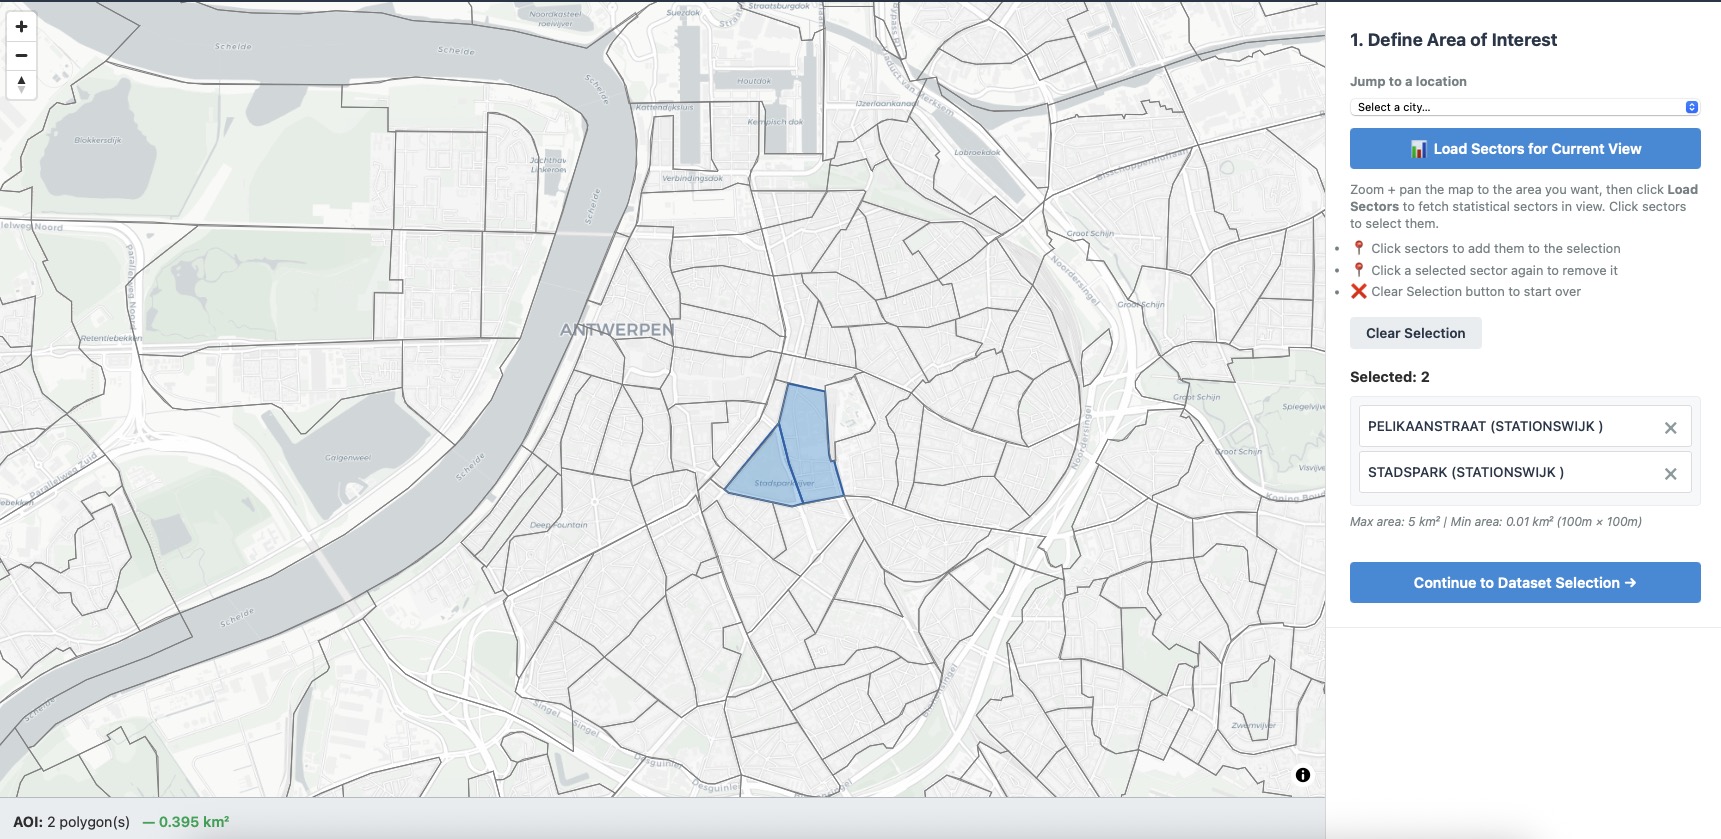
Defining the study area by selecting the official census sectors under the map.
Then choose the data.
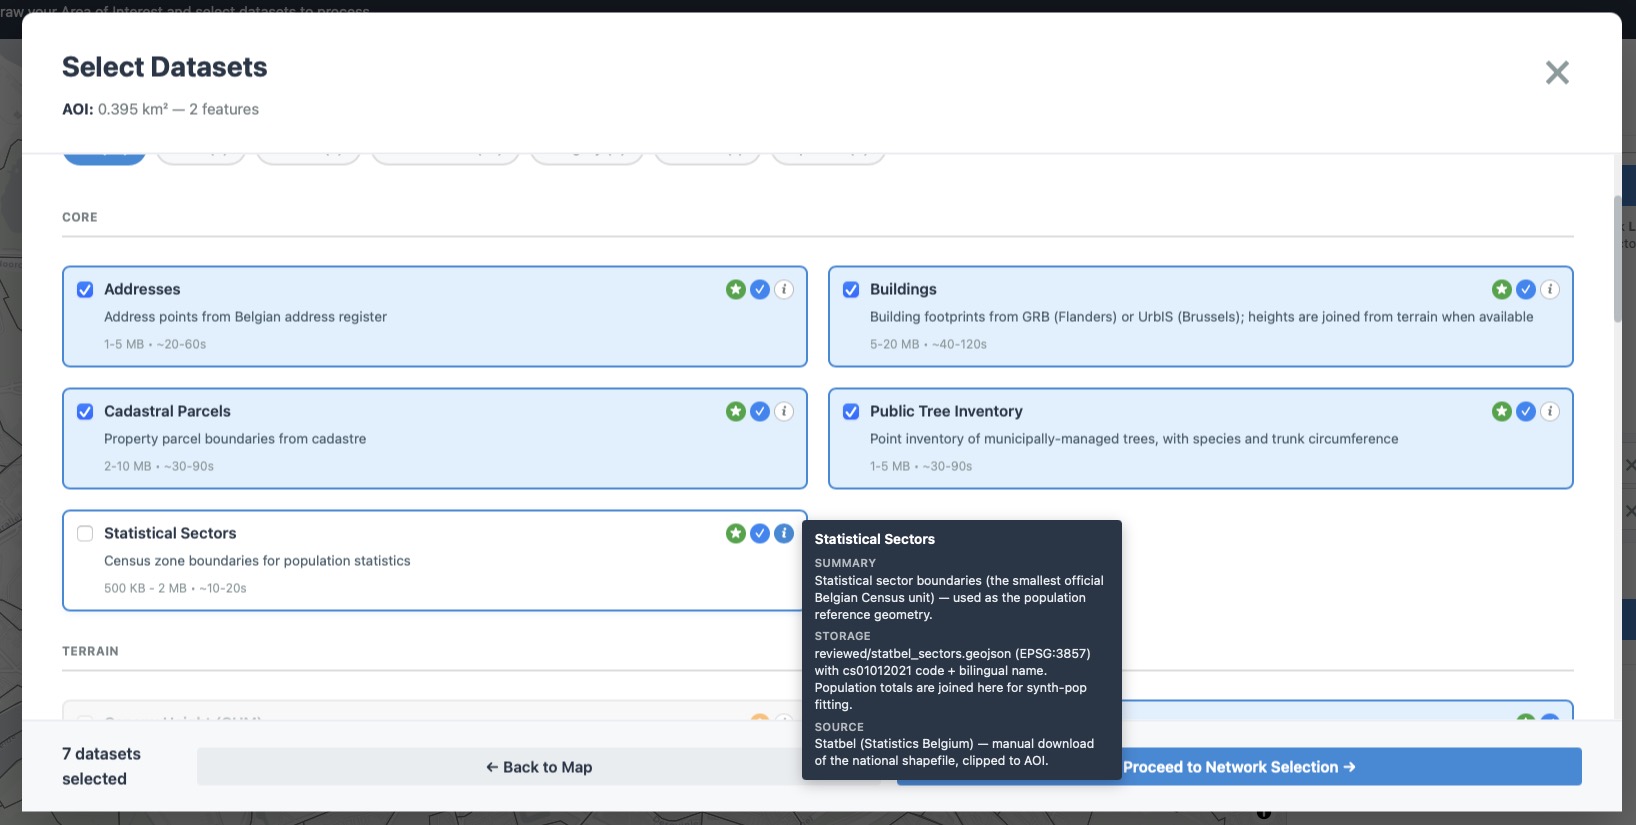
Choosing datasets, each card showing its size, fetch time and provenance up front.
Then tune the networks, walking, cycling, driving and transit, cleaned and ready for analysis. Then it runs and returns a folder of standardised files.
The tool detects the region from the area you pick and routes every dataset to the right local source, with region-aware labels throughout. Adding a new region is the same short path again, catalogue entries and source mappings, no new engine.
Some data cannot be downloaded. It classifies buildings into dwellings, synthesises households and individuals, and fits their age and sex distributions to the official census to under 5% error. For one Antwerp neighbourhood that is 3,877 households and 11,308 individuals, ready to model against.
One tool that collapses the slowest, least reproducible part of every urban study into a few minutes of clicking, and does it the same way in any region it is pointed at.