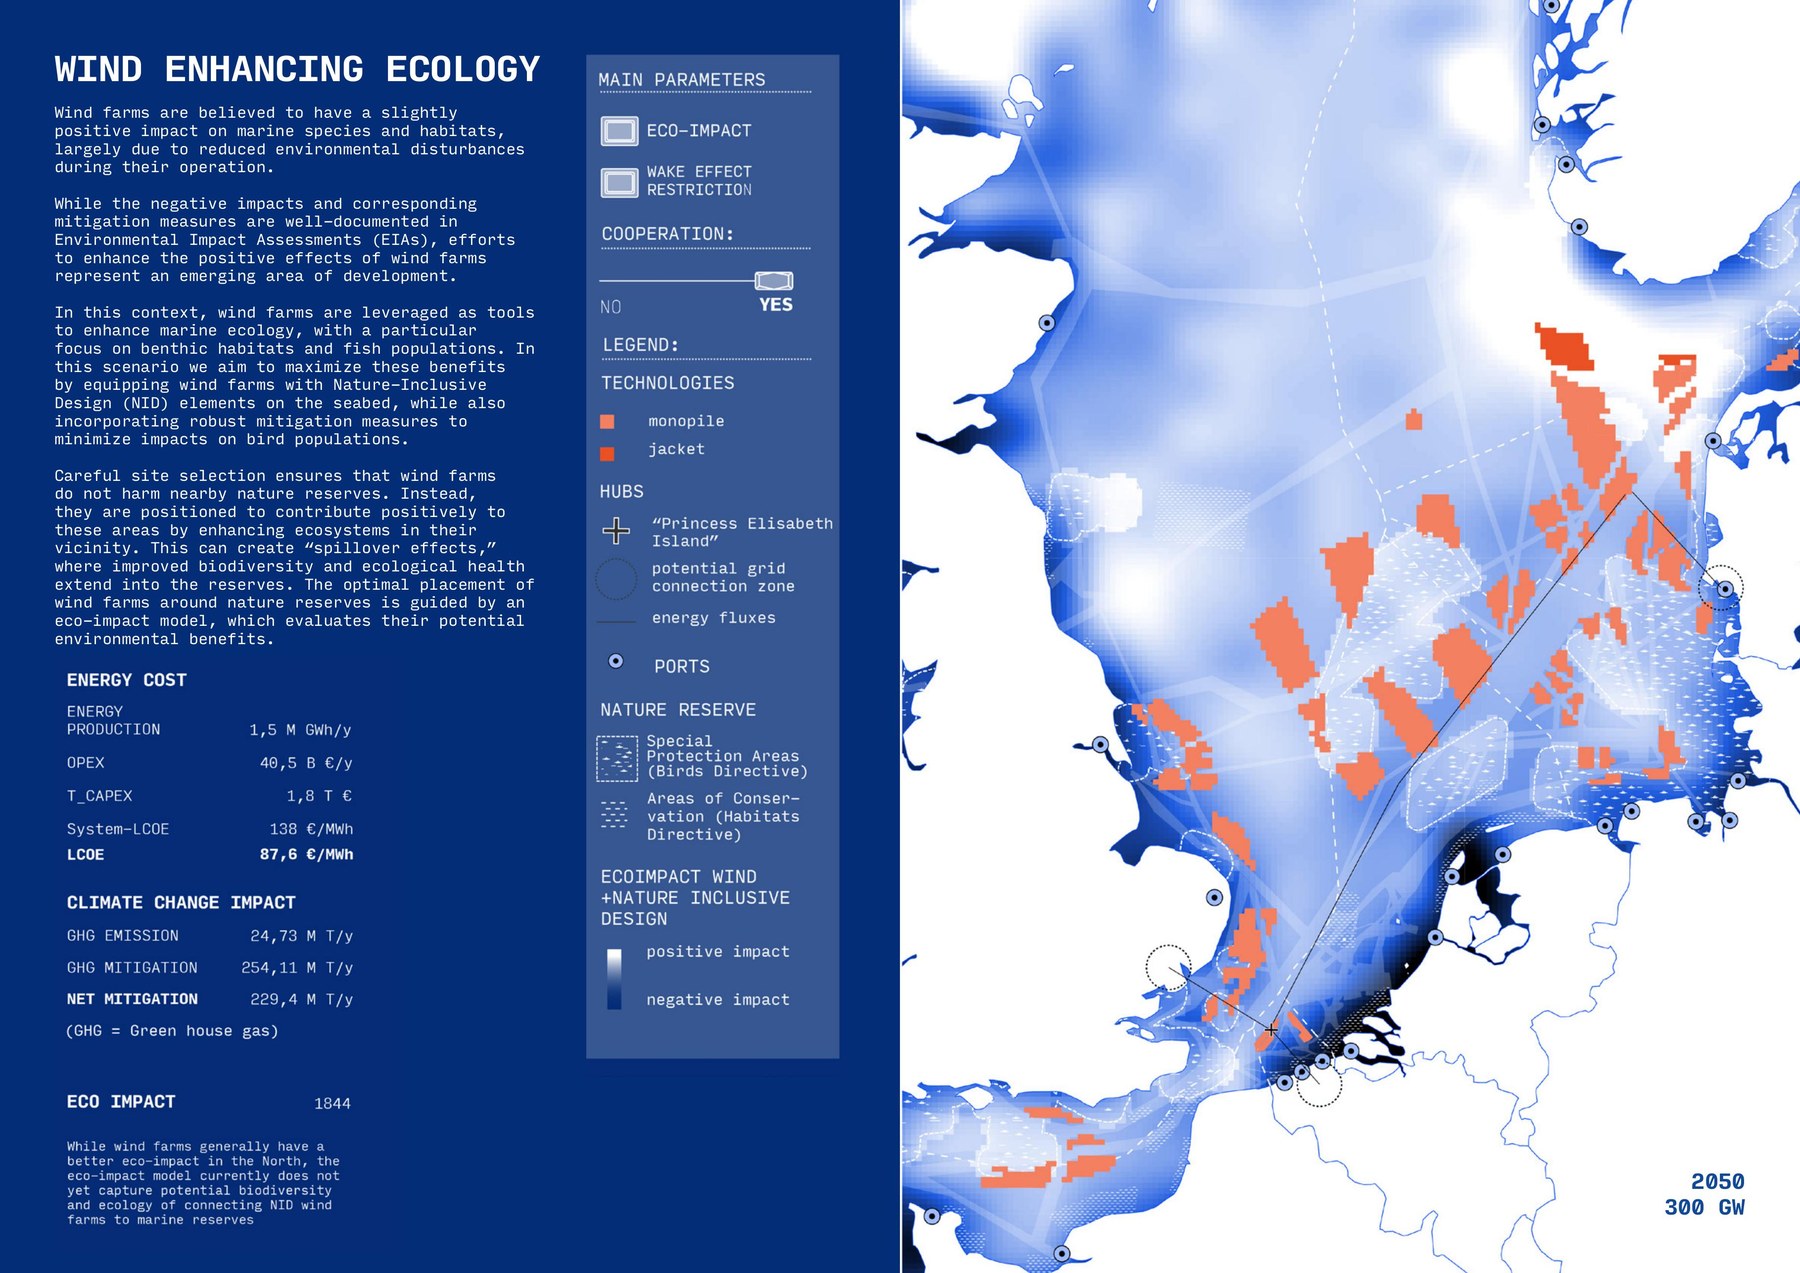
The Ecology scenario: wind capacity redistributed to protect Natura 2000 habitat, at a modelled cost of +€5.2 B/yr in operating expenditure. Magazine design: Caterina Dubini & Martina Bianchini.
A linear-optimization engine that turns one of the world's most contested seas into defensible trade-off scenarios by balancing offshore resource generation, environmental considerations, and the marine spatial plans of seven countries.
The Ecology scenario: wind capacity redistributed to protect Natura 2000 habitat, at a modelled cost of +€5.2 B/yr in operating expenditure. Magazine design: Caterina Dubini & Martina Bianchini.
The North Sea is one of the most contested seas in the world. There are seven different countries with territory within the sea, each of which has its own spatial plan for their EEZs; on top of that the EU has set various energy and environmental targets.
The question the project set out to answer was simple: can we initiate discussion between all the actors within the North Sea? The solution for us was to provide a transparent model that let policymakers see, in hard numbers, what each priority costs the others.
I framed the sea as a linear optimization problem. The study area was divided into candidate zones, each of which could be assigned to wind, fishery, conservation, or mixed use. An objective function weighed energy yield, ecological value, and food production; a set of hard constraints encoded the things that simply cannot be violated: shipping separation, protected sites, minimum spacing between farms.
The whole thing was built in open-source Python, with PuLP to express the model and HiGHS as the solver, sitting on a GeoPandas spatial backbone that harmonised the seven countries' data into one coordinate system and one set of units.
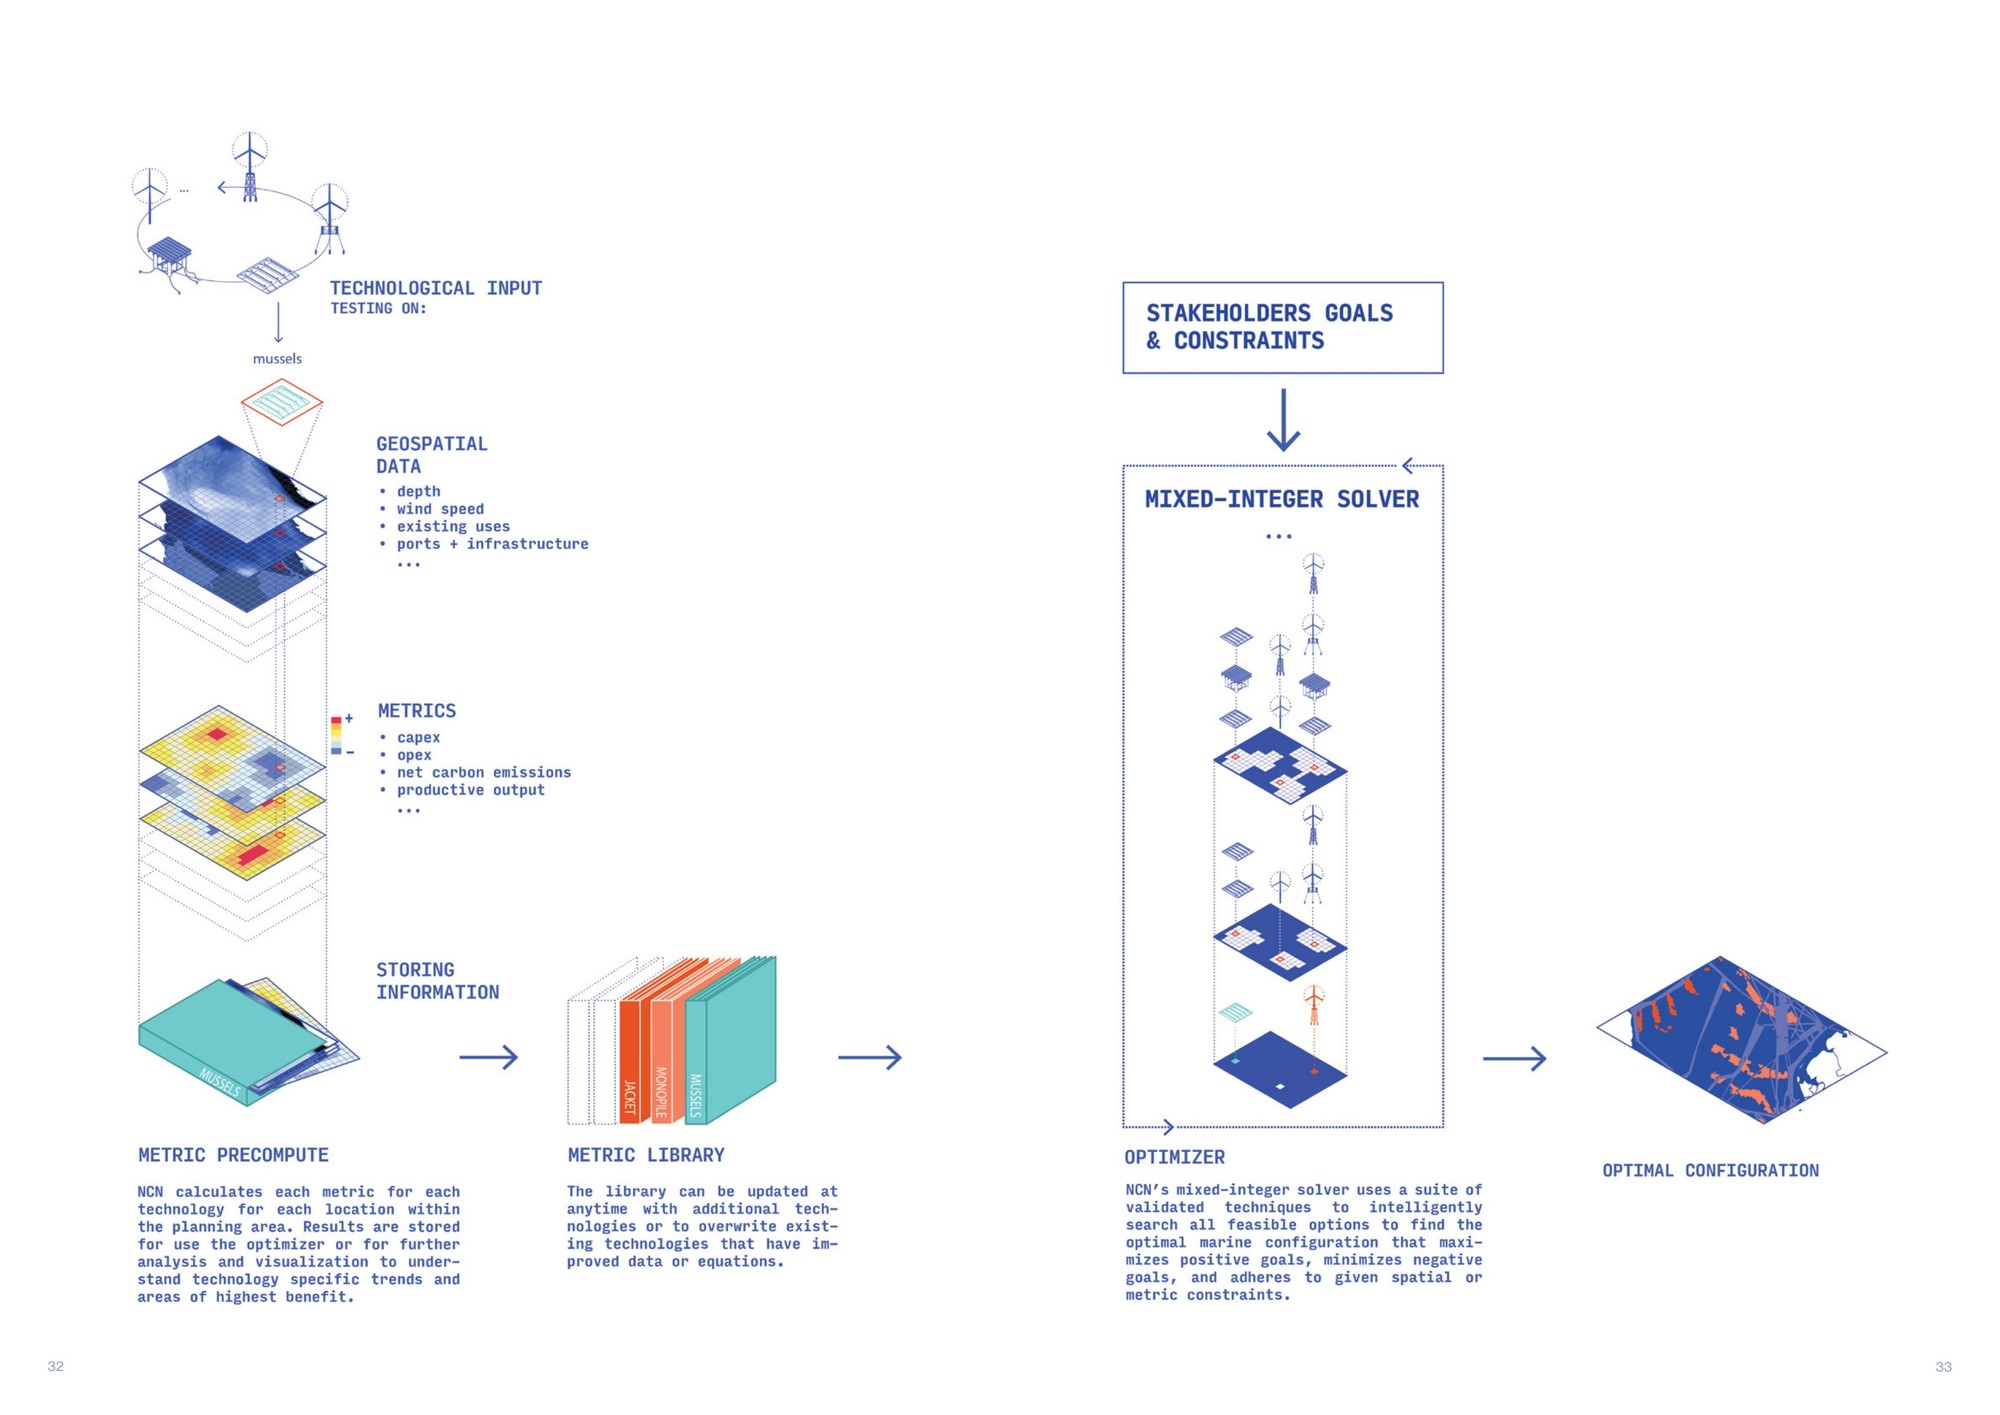
The North C Neutral engine end to end: geospatial and technology inputs are precomputed into a metric library, then a mixed-integer solver searches that library against each stakeholder's goals and constraints to return an optimal marine configuration. Magazine design: Caterina Dubini & Martina Bianchini.
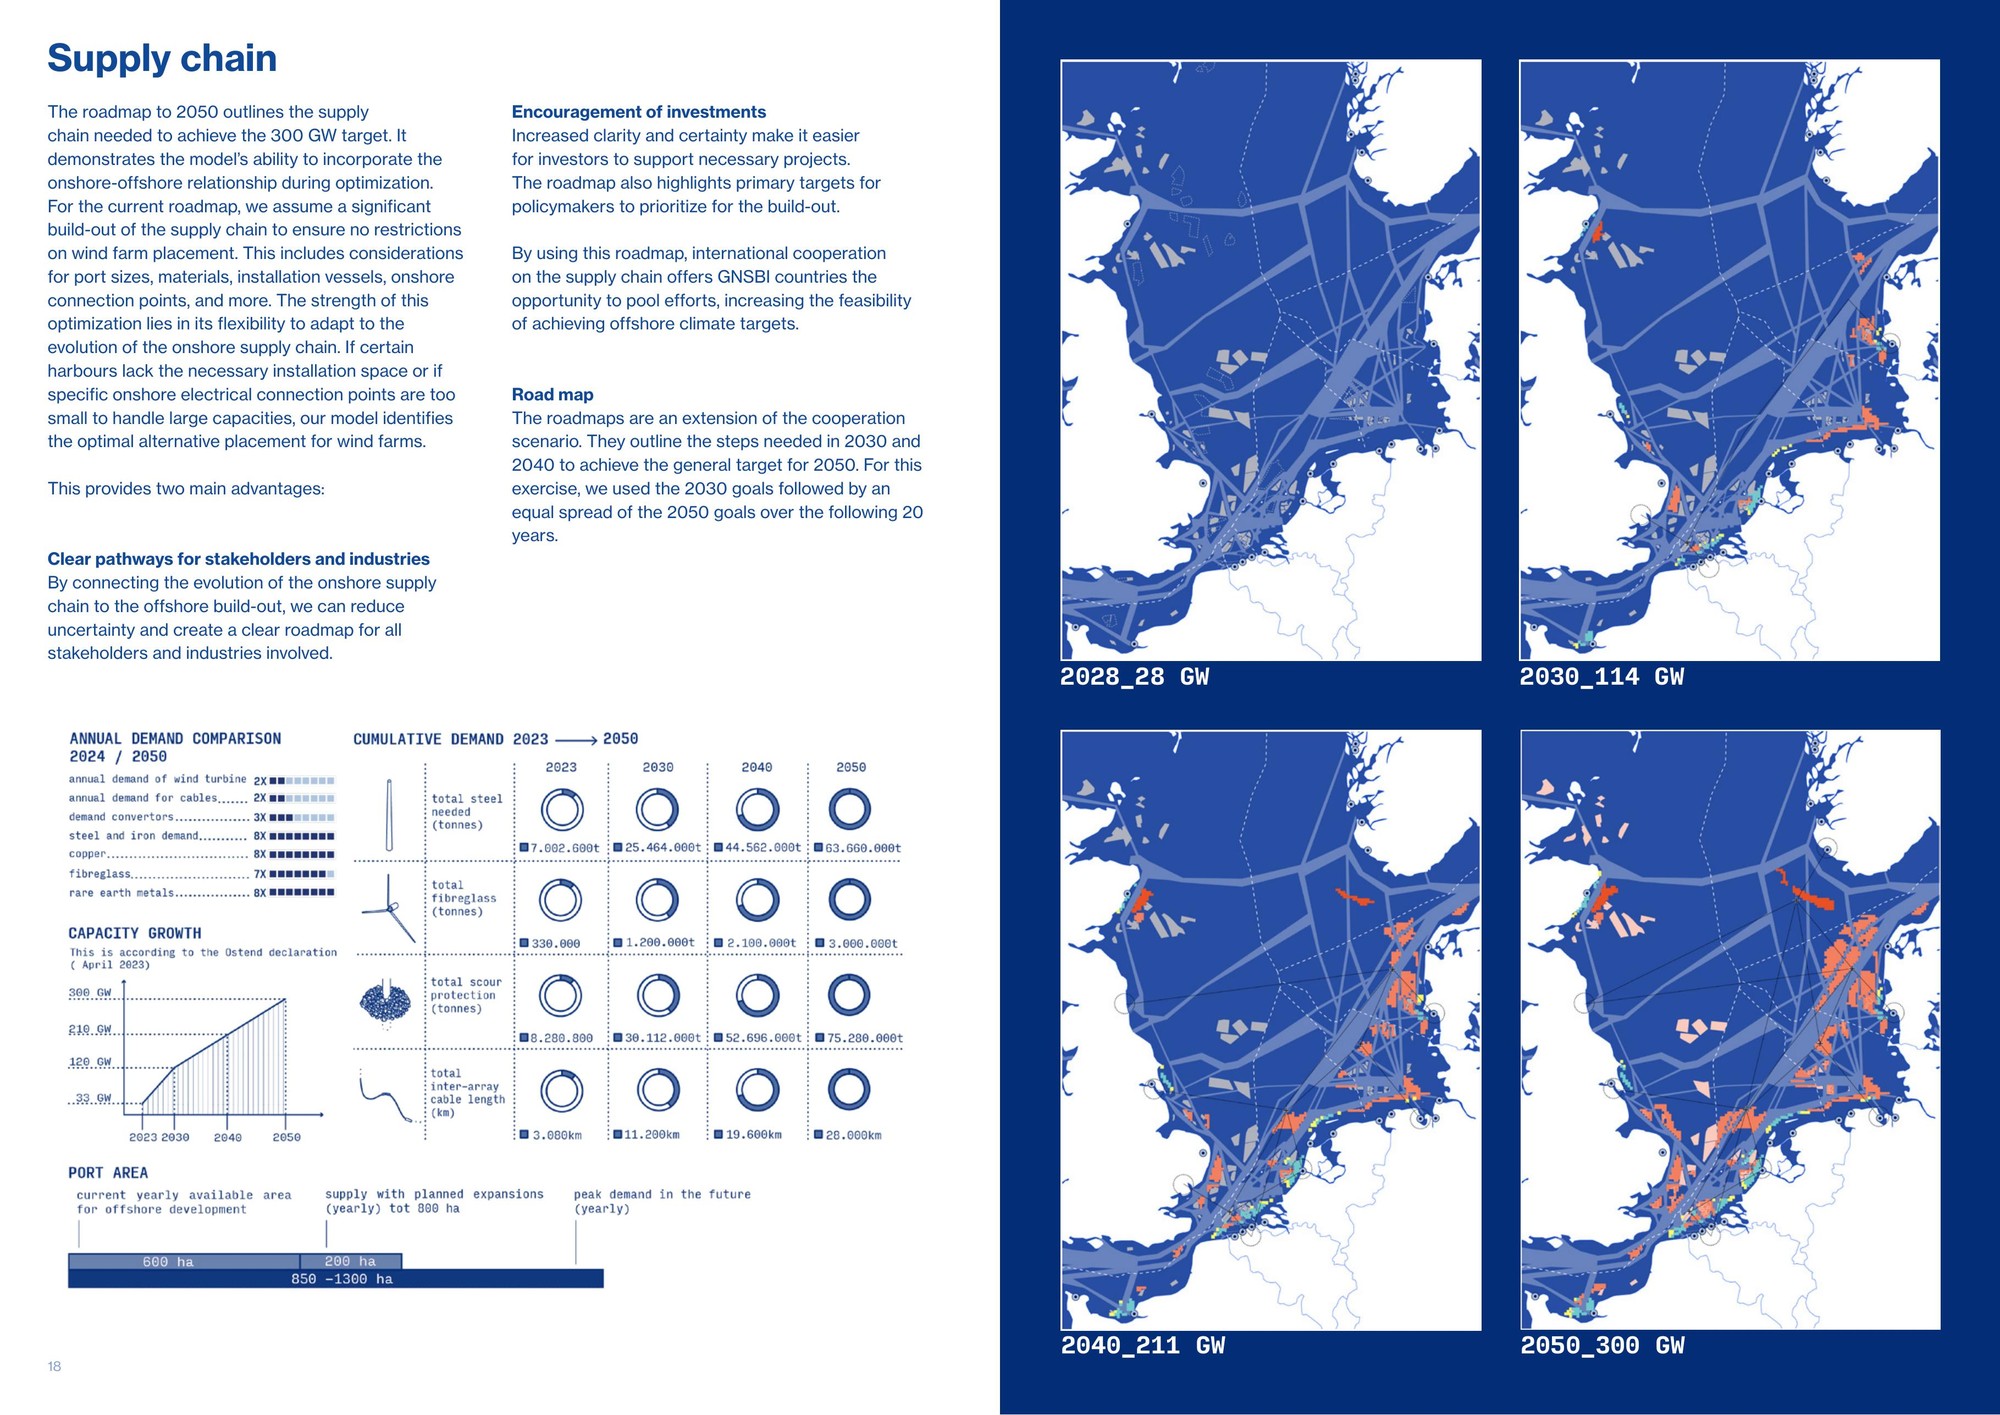
The supply-chain roadmap to 300 GW: the model phases the build-out across the basin from 2028 to 2050, checking that ports, installation vessels, and grid connections can keep pace with each step. Magazine design: Caterina Dubini & Martina Bianchini.
The model produced four contrasting scenarios: business-as-usual, energy-first, fishery-protective, and ecology-protective, each with a full set of comparable metrics. For the first time the trade-offs were quantified rather than asserted: an ecology-protective layout, for instance, raised the levelised cost of energy but measurably increased the ecological index and preserved fishing grounds.
The work fed into a public-facing exhibit and a technical decision-support tool, giving non-technical stakeholders a way to explore the consequences of their preferences directly.
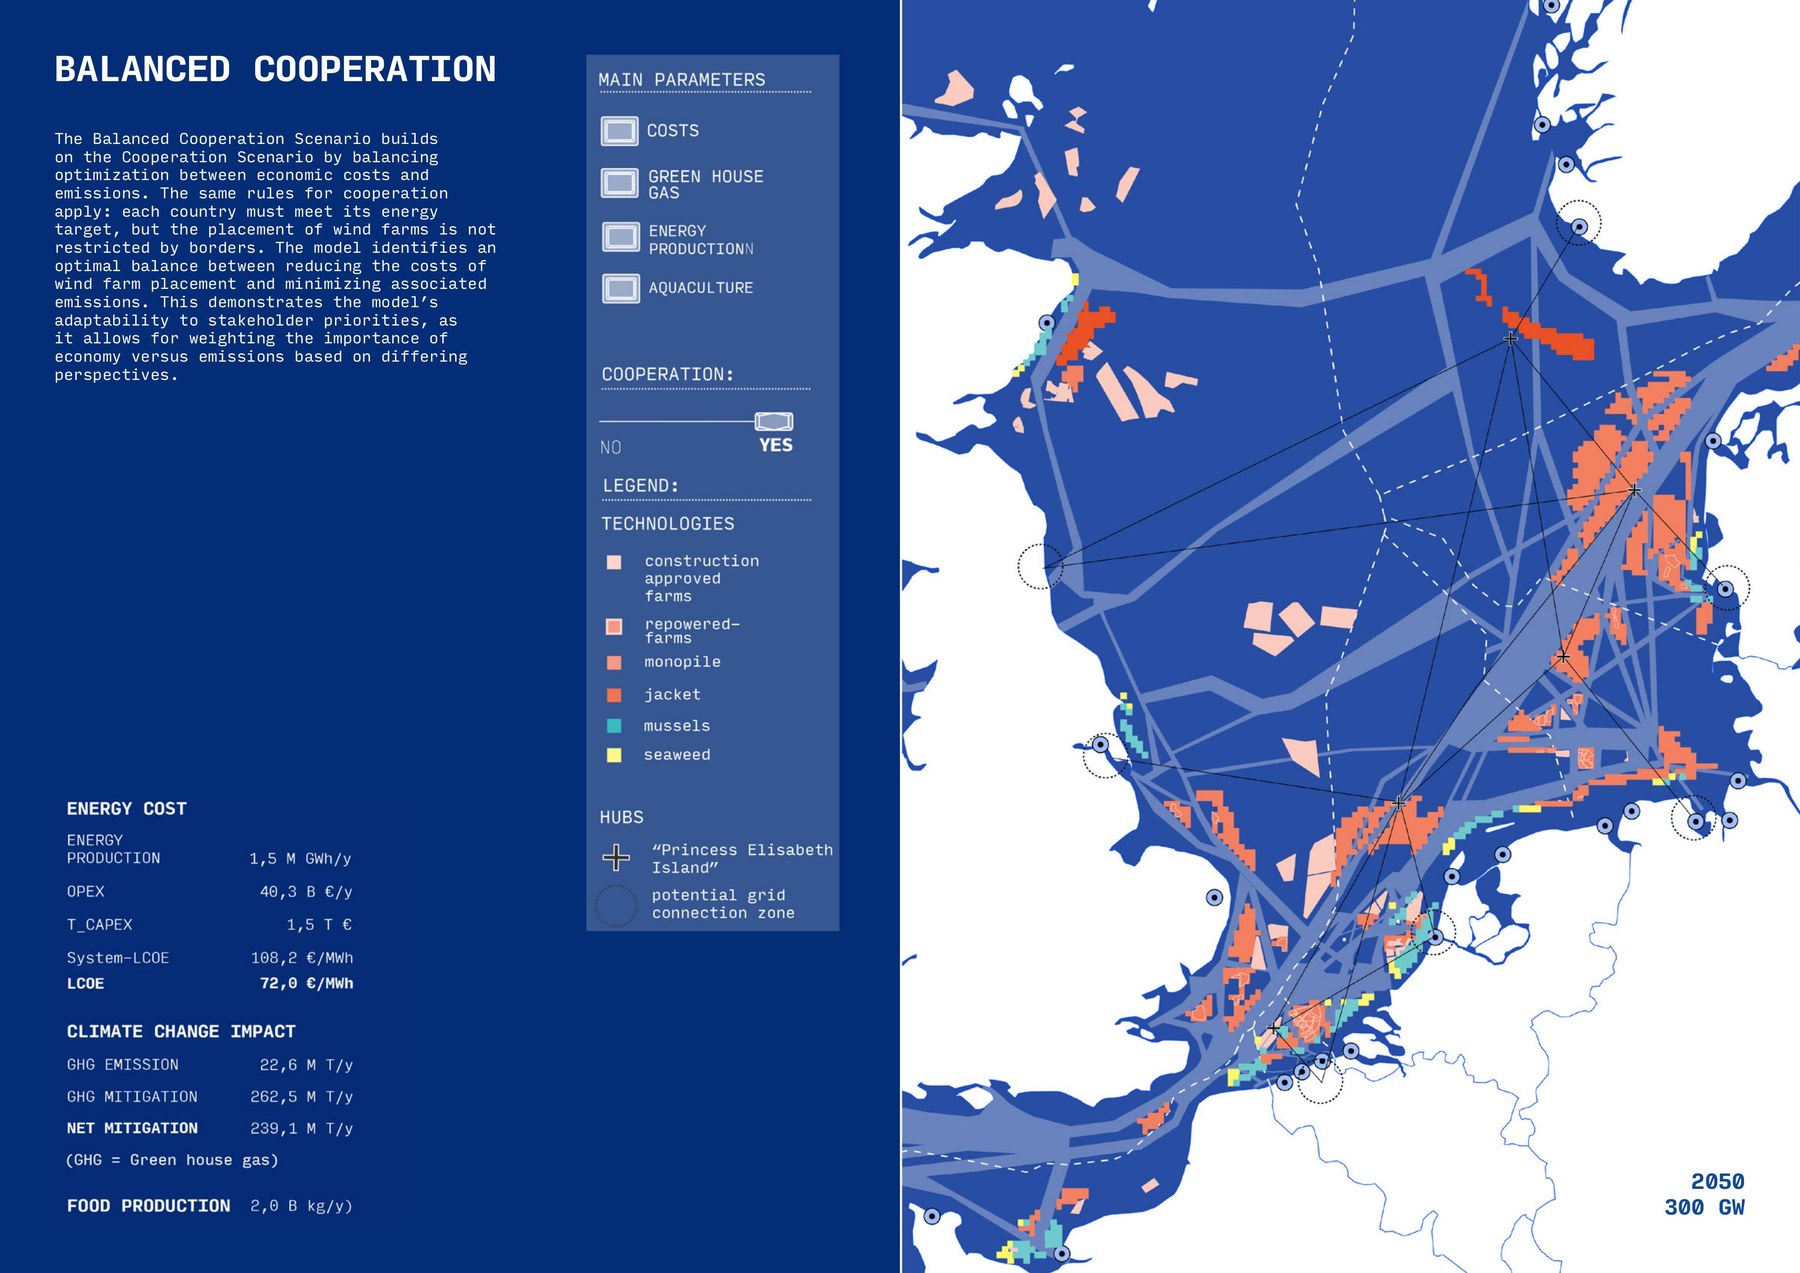
The Balanced Cooperation scenario: the model trades wind-farm placement against emissions to balance economic cost and climate impact, one of the four contrasting outputs it produces. Magazine design: Caterina Dubini & Martina Bianchini.