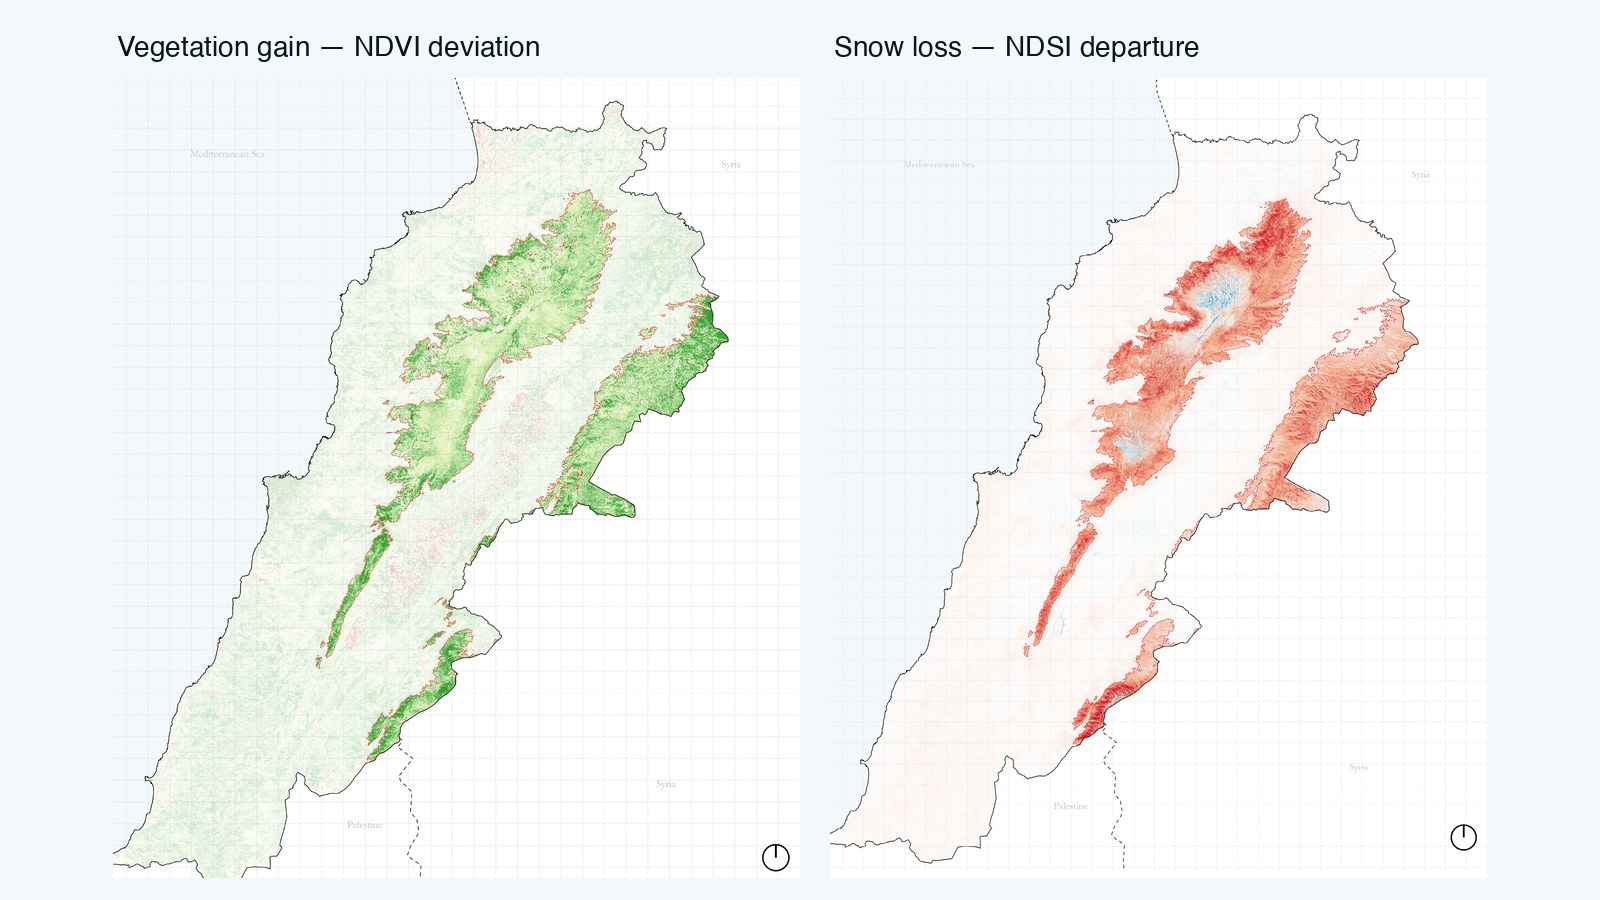
The same mountains, two indices: vegetation gaining (left) where snow is retreating (right). The greening and the snow loss trace the same high-mountain spine.
A satellite time-series read of Lebanon's high mountains: as snow cover has steadily retreated over 36 years, vegetation has advanced up the same slopes: the NDVI and NDSI analysis behind ORG's Land Degradation Neutrality diagnostic.
The same mountains, two indices: vegetation gaining (left) where snow is retreating (right). The greening and the snow loss trace the same high-mountain spine.
ORG was preparing a Land Degradation Neutrality (LDN) diagnostic for the High Mountains of Lebanon: the terrain above 1,500 m. My part was the remote-sensing analysis: use the satellite record to test what was happening to vegetation and snow across the range, and whether the two were connected. A comparison of 1998 and 2017 land-cover maps hinted that the mountains were gaining vegetation; the question was whether that was real, and if so, why.
I built the whole thing on the Landsat archive through Google Earth Engine:
The two records move in opposite directions. Snow cover shows a clear, sustained decline across the 36 years, while vegetation shows an equally clear rise.
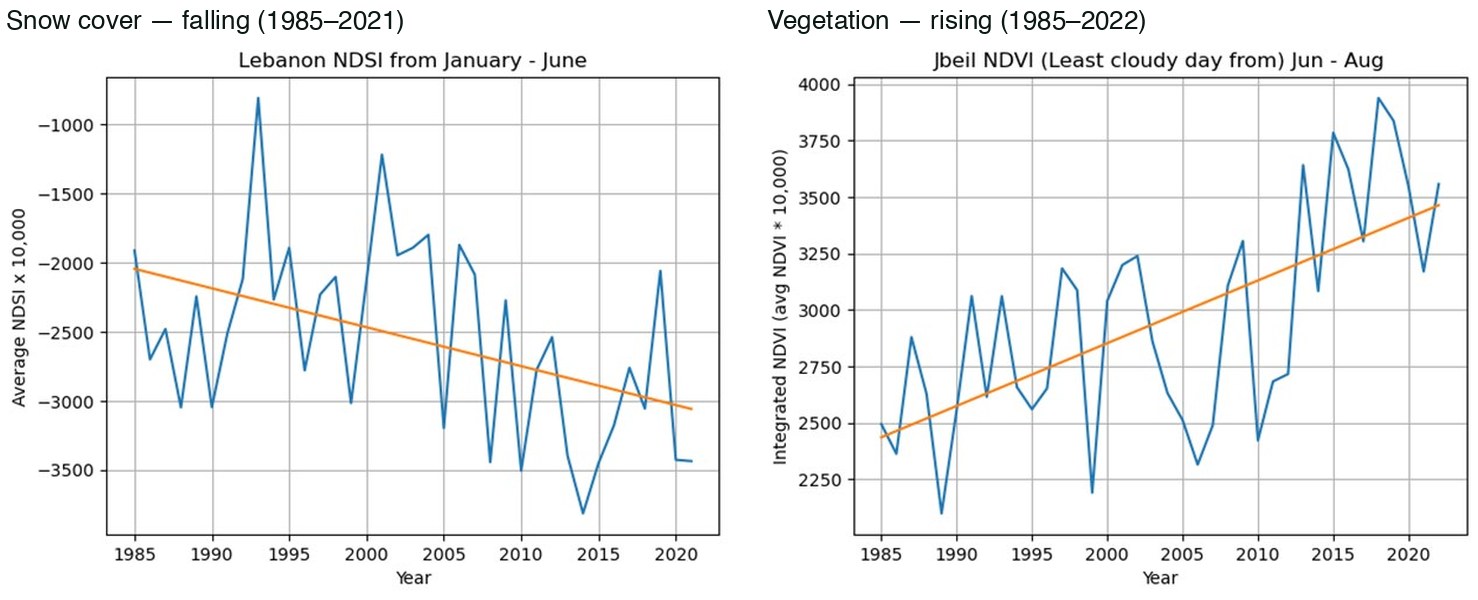
Snow cover (NDSI) falling and vegetation (NDVI) rising over the same period: the inverse trends that framed the question.
Mapped in space, the coupling is unmistakable: the vegetation gain and the snow loss trace the same high-mountain spine. Where the snow line has retreated above 1,500 m, vegetation has moved in behind it: the classic signature of a warming mountain.
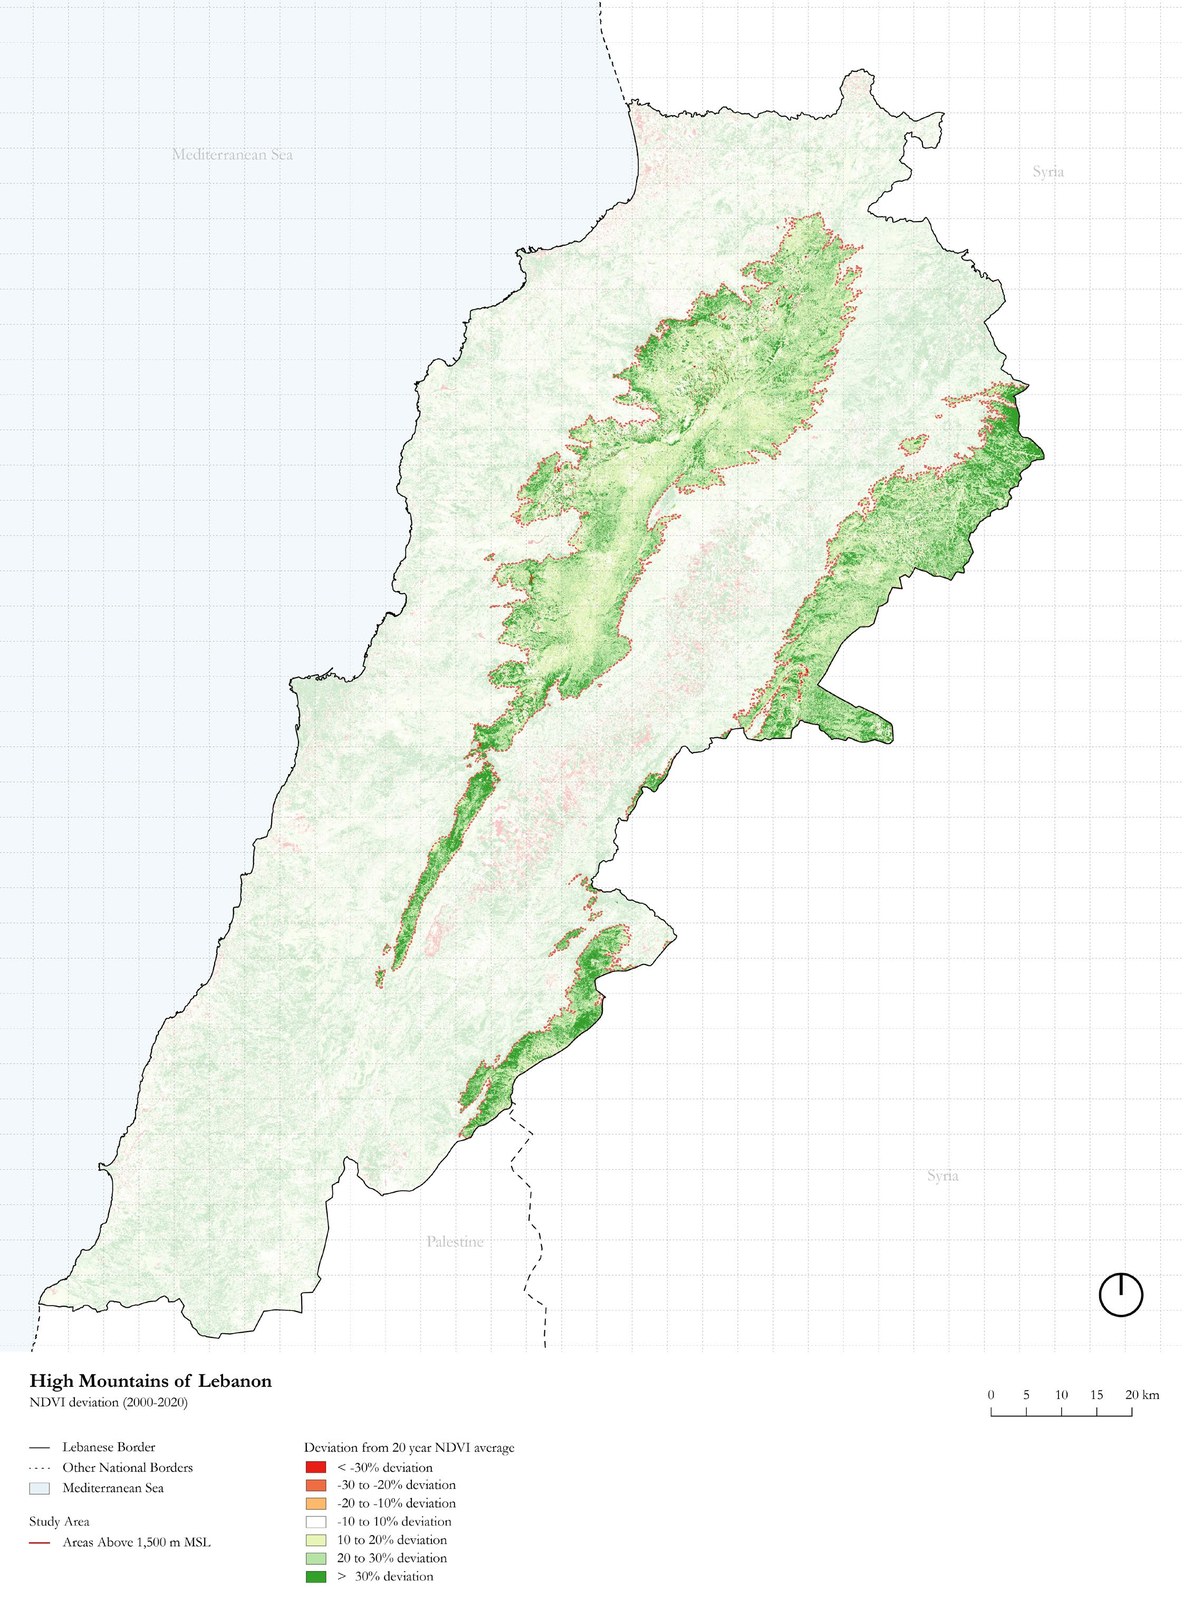
NDVI deviation from the 2000–2020 average across Lebanon. Green marks vegetation gain, red degradation; the strongest greening runs along the high-mountain spine.
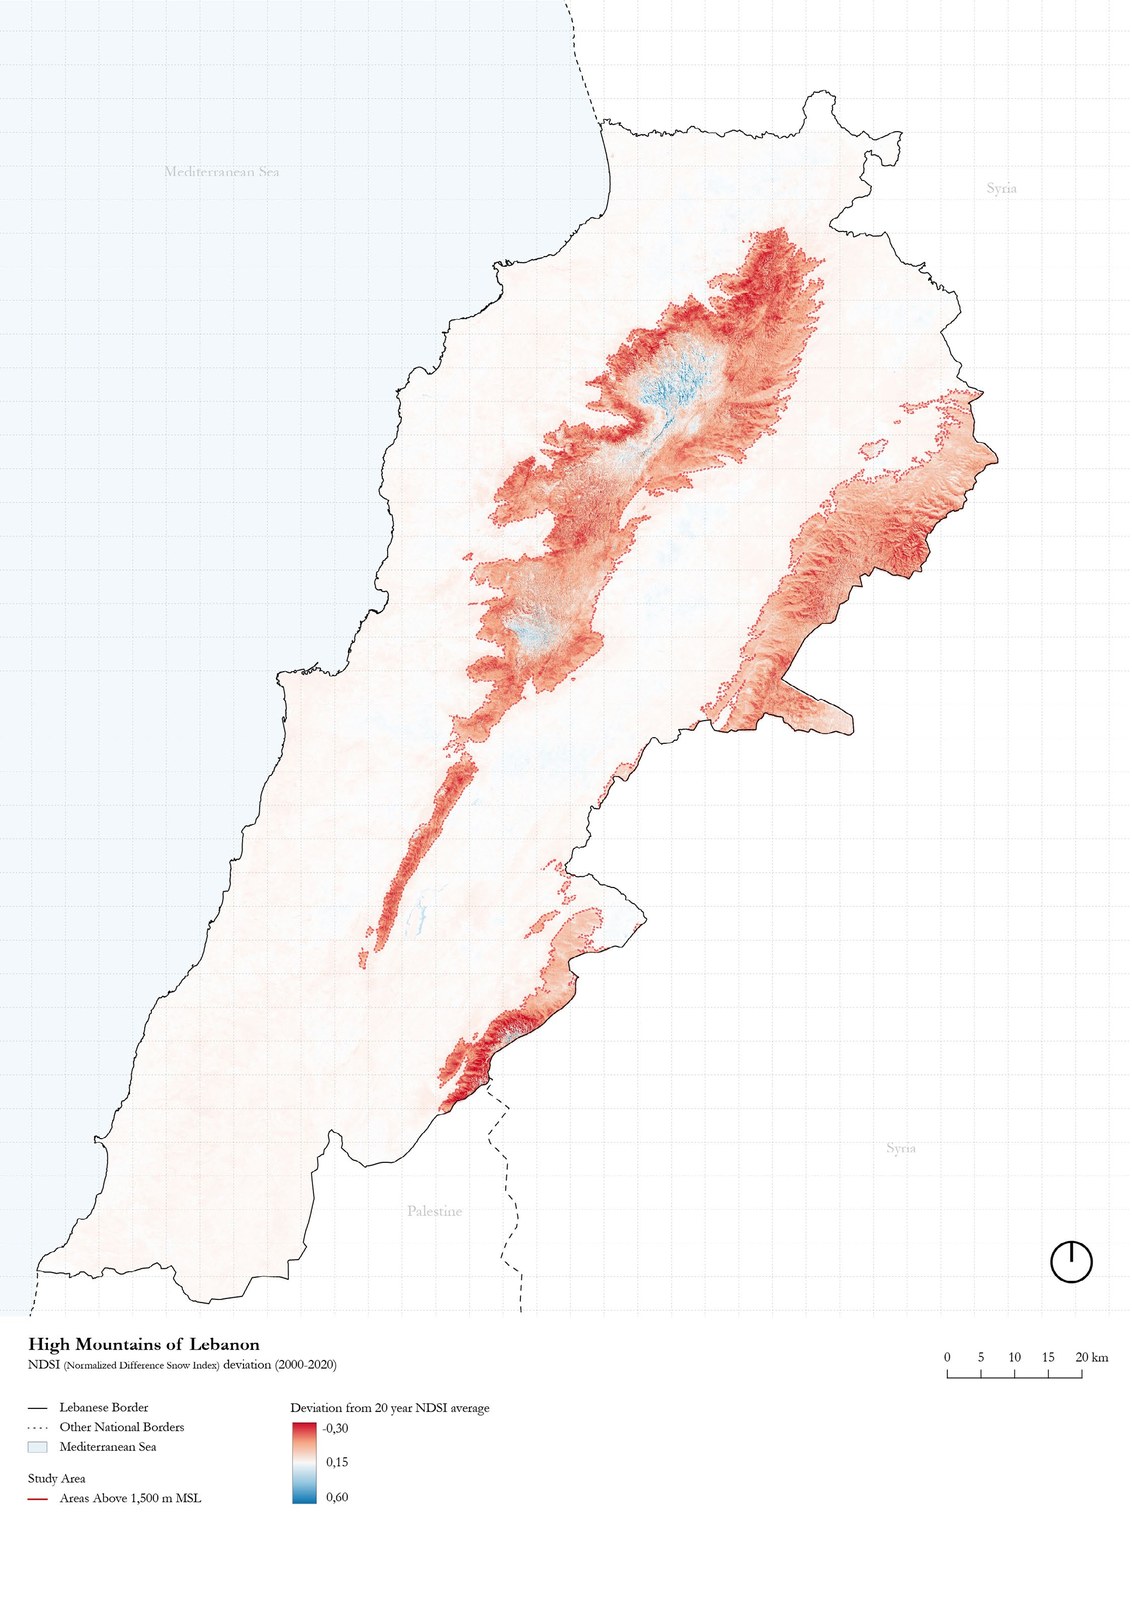
Departure from average snow cover (NDSI) in the High Mountains. Red marks snow loss, concentrated along the same spine that is greening.
It gave the diagnostic a defensible, evidence-based answer: the greening is real, it concentrates at altitude, and it is bound up with the retreat of the mountain snowpack: a signal worth monitoring closely.