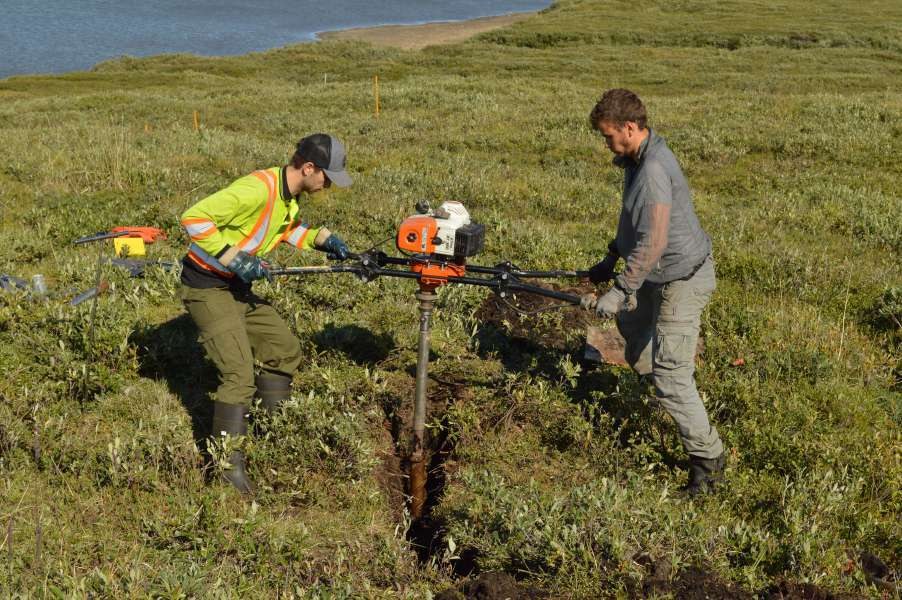
Drilling into ice wedge T2 at Illisarvik, August 2022, with field assistant Aidan Gill. A gas auger and a 50 mm core barrel, working across the trench hole by hole.
My MSc at Carleton, on what stable isotopes in Arctic water can and cannot tell you. Back-trajectories for 111 storms at Inuvik, five winters of snow pits, and 101 ice samples augered out of hillslope ice wedges at Illisarvik, on the Beaufort coast. The finding: ice wedges are not made purely of winter snow.
Drilling into ice wedge T2 at Illisarvik, August 2022, with field assistant Aidan Gill. A gas auger and a 50 mm core barrel, working across the trench hole by hole.
Stable isotopes are the standard thermometer for the deep past. The ratio of ¹⁸O to ¹⁶O in precipitation tracks air temperature, so ice that formed from old snow ought to carry a record of the winters that made it. In the Arctic, the ice read this way is ice-wedge ice: V-shaped bodies of massive ice that grow in permafrost when the ground contracts and cracks in the cold and meltwater runs into the crack each spring and freezes. Crack by crack, they are supposed to be an archive of winter precipitation reaching back millennia.
My thesis went to the western Canadian Arctic to test both ends of that assumption at once. What actually controls the isotopic signal in precipitation falling today, and does the ice in the wedges match it?
Two sites in the Mackenzie Delta area, Northwest Territories.
Inuvik, at the head of the delta, where precipitation has been sampled event by event and the snowpack measured for decades. And Illisarvik, out on the west point of Richards Island on the Beaufort coast: a drained-lake basin that has been a permafrost research site since J. Ross Mackay deliberately drained the lake in 1978 to watch permafrost grow into the exposed bed.
The hillslopes around that basin carry anti-syngenetic ice wedges. Where most wedges grow upward as sediment accumulates over them, these form where the surface is eroding and the permafrost table is sinking, so the wedge grows downward and sits wide and shallow just under the active layer. That geometry is why the site works. On a coastal exposure you sample whatever the sea happens to have cut through; here you can trench across an entire wedge and sample it end to end, oldest ice at the edges, youngest in the middle, working from above.
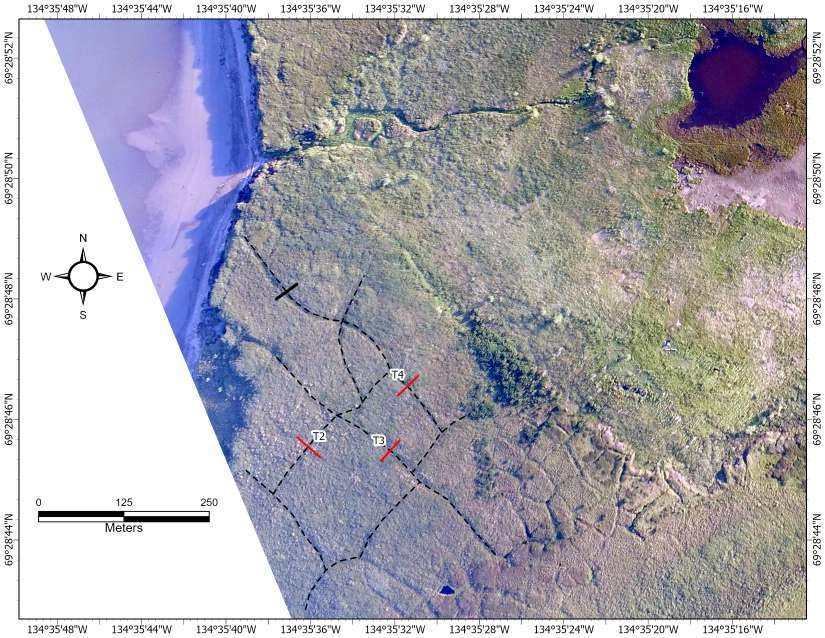
The three western wedges at Illisarvik from the air. Dashed lines trace the ice-wedge polygon network; the red bars are the trenches dug across T2, T3 and T4.
Precipitation collected at the Aurora Research Institute in Inuvik between August 2015 and August 2018 gave a storm-by-storm record. I ran each event back through the NOAA HYSPLIT model, generating 315-hour back-trajectories at three heights in the atmosphere on the GDAS meteorological grid, to find where the air mass had been before it snowed or rained on Inuvik. Where the three heights disagreed, the storm was dropped. That left 111 storms of the 134 sampled, backed by a cluster analysis over all 558 precipitation events in the period.
Sixty per cent came from the North, off the nearby Beaufort Sea. Twenty-six per cent came from the South, off the Pacific. Thirteen per cent came from the West, off the Bering and Chukchi Seas.
Then the surprise: the δ¹⁸O values barely care. Sorted by origin and by season, the means are statistically indistinguishable. What is not indistinguishable is the temperature. Winter storms out of the South arrive about 10 °C warmer than northern ones and carry the same isotopic signal.
The mountains explain it. Pacific air has to cross the Coast and St. Elias ranges and then the Mackenzies; Bering air crosses the Brooks Range and the Richardsons. Every range strips out heavy isotopes on the way over, roughly 0.6‰ of δ¹⁸O for every 100 m climbed. By the time a warm southern storm reaches Inuvik it has been fractionated down to the same depleted value as a cold storm straight off the Arctic Ocean.
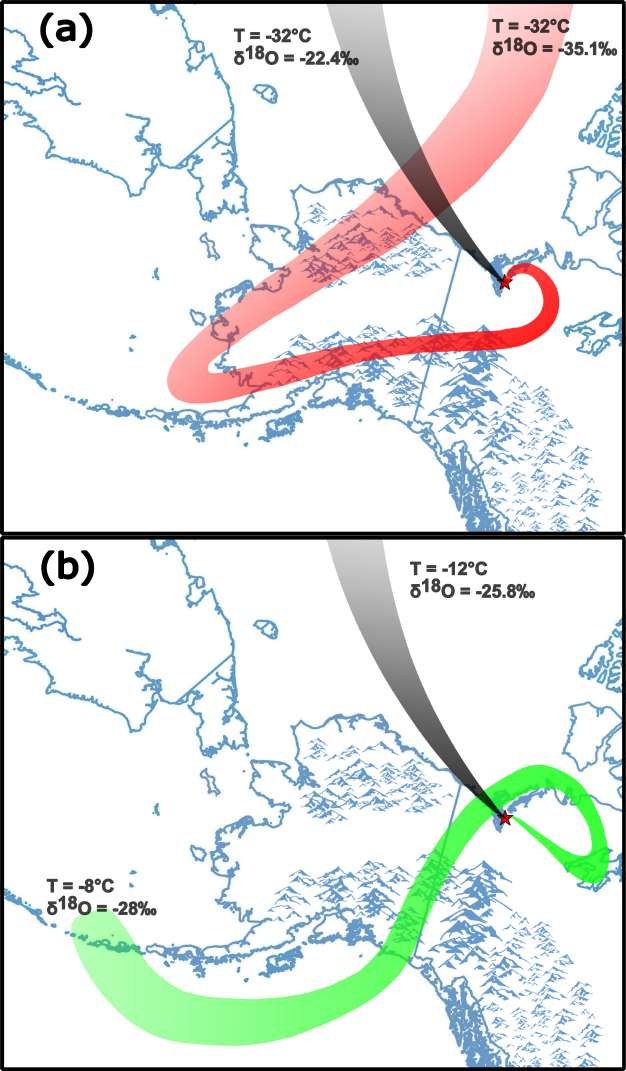
Two winter storms reaching Inuvik. Air arriving directly from the North (grey) and air that has crossed the western Cordillera deliver nearly the same δ¹⁸O at temperatures 20 °C apart.
Deuterium excess behaves better. It separates the seasons cleanly and holds that separation regardless of how much mountain fractionation the air mass has been through: near 9‰ in winter, near 3‰ in summer. Where δ¹⁸O loses the signal, d-excess keeps it.
Between 1991 and 1995 Chris Burn dug 78 end-of-winter snow pits near Inuvik, 41 on lakes and 37 in forest, sampling the full column. Those data had never been published.
They settle a useful point. The lake and forest pits are statistically identical, and the pack as a whole reproduces mean winter precipitation for the region. So the end-of-winter snowpack really is a fair integrator of the winter that made it, and the isotopic uniformity holds across quite different terrain. That matters for the wedges, because the snowpack is the water that is supposed to be filling them.
August 2022, Illisarvik. Six wedges: T2, T3 and T4 on the western side of the basin, E1, E2 and E3 on the eastern.
For each one, dig a trench two feet wide from ridge to ridge across the wedge, stopping at the frozen layer so thaw depth could be measured accurately. Mark an arbitrary middle point, then a drill hole every 30 cm outward to the left and right. Drill twice at each hole with a Stihl BT-360 gas auger and a 50 mm CRREL core barrel: once through the frozen soil at the base of the trench and 10 cm into the wedge, which gets measured and discarded, then clean the barrel of all soil and ice and drill again to 25 cm into the wedge for the sample itself. Priority on depth first, then integrity of the core, then purity. Double-bagged, carried back to camp, melted, sealed into 20 ml vials with tape against evaporation. Two boreholes on the tundra west of the basin went down to 290 cm.
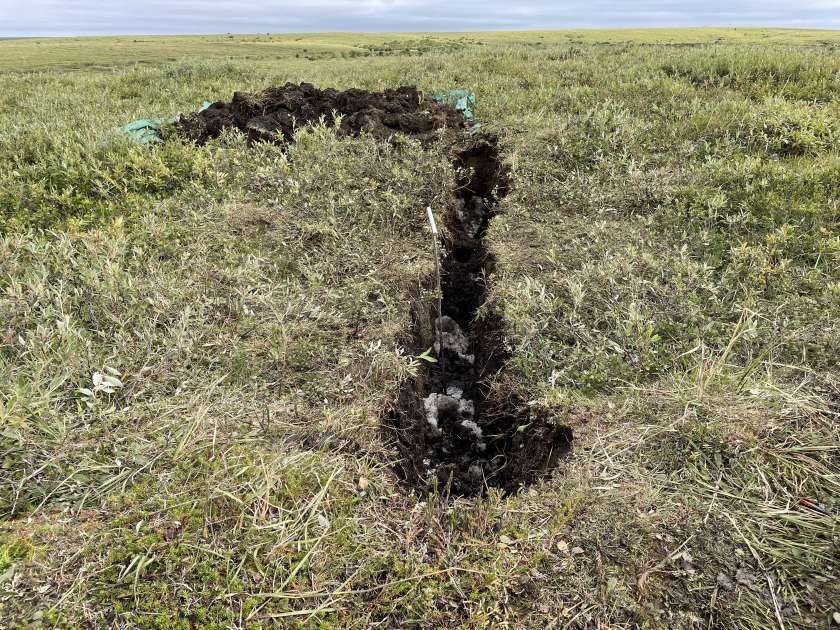
The trench at a wedge after drilling, dug ridge to ridge across the wedge. The northern slope of the Illisarvik drained lake basin is behind.
101 samples came home and ran within four months on a Los Gatos liquid-water isotope analyzer in Carleton's Water and Ice Research Lab.
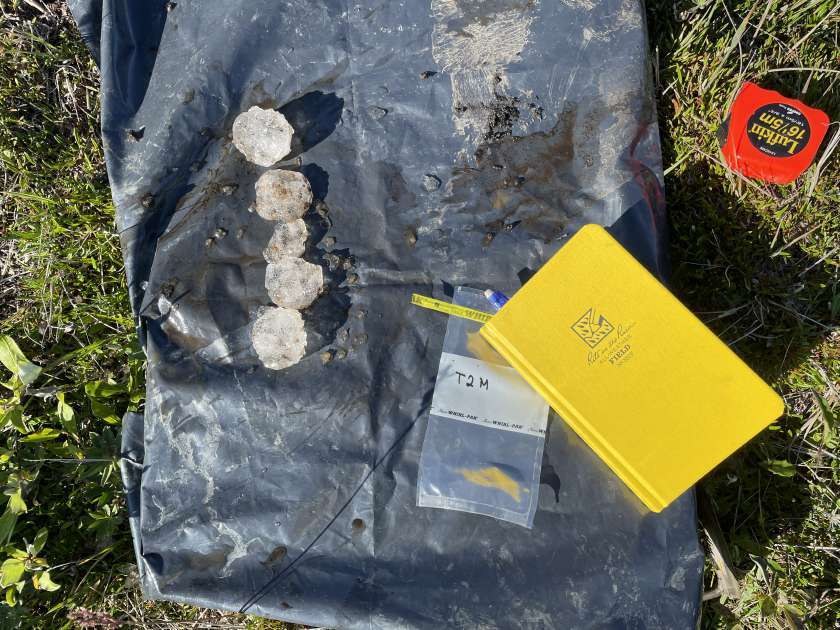
Ice recovered from wedge T2, cleaned of soil and excess ice, laid out before bagging.
The season was half of what it should have been. A COVID diagnosis the day before the July flight pushed my arrival into August and cut the field time in two, and the follow-up season planned for 2023 was cancelled by wildfires in the area. Aidan Gill and Chris Burn had the boreholes drilled and camp standing before I landed, so drilling into the wedges could start the hour I got there.
The boreholes found the Holocene. Below roughly 240 cm the ice carries δ¹⁸O under −28‰, a Pleistocene signal. Above it the values climb, and the d-excess changes character with them. That step is a thaw unconformity: the depth to which this ground thawed during the Holocene Thermal Maximum, when the coast was warm enough that Illisarvik sat in forest rather than tundra as recently as 6,500 years ago. Everything above the line is Holocene water worked into Pleistocene ground by repeated freeze and thaw.
The two sides of the basin are not the same. Western wedges are narrow, about 3 m, with flat surfaces, and their ice is Holocene throughout; they have been growing since the Thermal Maximum. Eastern wedges are wider, about 6 m, with uneven surfaces, and at the edges of E3 the ice drops to −29‰. That is Pleistocene ice, surviving only at the margins, most of it already ground away as the hillslope crept downhill over the wedge.
And the ice is too heavy. Across all six wedges the ice is consistently less depleted than the winter precipitation and the snowpack that are supposed to have made it. If wedge ice were simply refrozen winter snowmelt, the numbers would line up. They do not, and they have not lined up in the other studies that have looked either.
Two conclusions travel beyond this basin.
The first is a caution about the proxy. In the western Canadian Arctic, precipitation isotopes are insensitive to where a storm came from, because mountain fractionation and Arctic cold happen to arrive at the same signal by different routes. A substantial shift in circulation could change regional temperature and leave almost no isotopic trace. Anyone reconstructing climate here from δ¹⁸O alone needs to know that, and d-excess is the more honest seasonal marker.
The second is about the wedges. This is the first isotopic study of ice wedges explicitly identified as anti-syngenetic, and it puts the source-water problem squarely on the table. The theory of ice-wedge growth has assumed snowmelt since Mackay's work in the 1970s, and the isotopes keep saying otherwise. Something other than winter snow is getting into the crack, and finding out what it is calls for direct experiment on the water that infiltrates thermal-contraction cracks, alongside high-resolution elevation work on how the slope above each wedge routes water. That is where I would take it next.
Part of this work was published as a refereed paper at the 12th International Conference on Permafrost in Whitehorse in 2024.