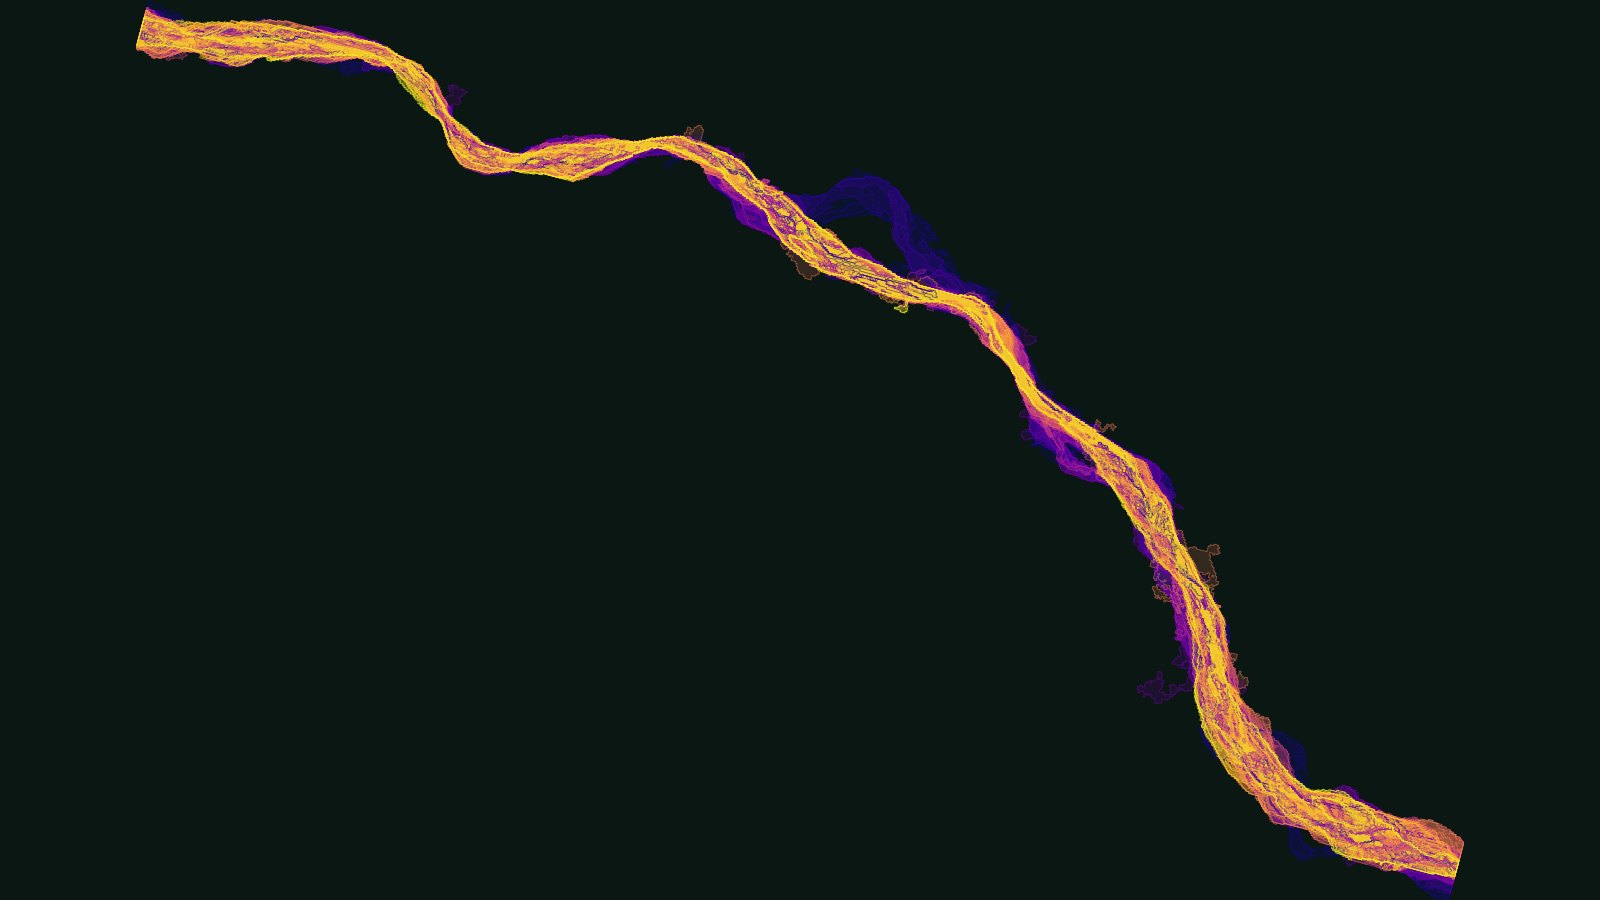
Thirty-nine years of the Río Piraí in a single frame: every year's channel from 1985 to 2023, showing a river that braids, migrates, and shrinks.
Four decades of Landsat imagery, turned into a baseline for a new metropolitan river park in Santa Cruz de la Sierra: how the Río Piraí has shifted and shrunk, where vegetation has come and gone, and what a flood would reach.
Thirty-nine years of the Río Piraí in a single frame: every year's channel from 1985 to 2023, showing a river that braids, migrates, and shrinks.
Santa Cruz de la Sierra, Bolivia's largest city, grew up beside a dangerous neighbour. In the early hours of 18 March 1983, the Río Piraí broke its banks in the Gran Turbión: a flood surge that swept away the Tarumá bridge, destroyed the village of El Chorrito, inundated the entire west side of the city and left hundreds dead and thousands homeless. The disaster reshaped Santa Cruz: it forced the creation of the Plan 3000 district for the displaced, and it established the cordón ecológico: a kilometre-wide belt of protective forest along the river's western bank.
That green corridor is what the city now wants to formalise as the Parque Lineal Ecológico Metropolitano (PLEM): a metropolitan ecological park along the Piraí. But designing a park on the floodplain of a river that has already destroyed one demands knowing exactly how that river behaves: where it has been, how much it moves, and what the next flood would reach. I built the remote-sensing baseline for that plan at ORG Urbanism & Architecture (with consultant partner Diana Wiesner Arquitectura y Paisaje), assembled entirely from open satellite data.
The backbone is the Landsat archive (missions 5, 7 and 8), reaching back to 1985, pulled through Google Earth Engine. For every year I collected all cloud-free scenes and reduced them to a single mean composite per pixel, applying the newer cross-mission scaling factors so imagery from different satellites is directly comparable. For the flood work I added daily rainfall from 12 weather stations across the Piraí basin (1980–2020).
Three connected studies, all in open-source Python:
Overlaying all 39 years of the channel shows a river that never sits still: braiding, migrating, and, above all, shrinking. In the wider corridor the river's area fell by about a third since 1985; inside the park area itself it has all but vanished, down roughly 97%.
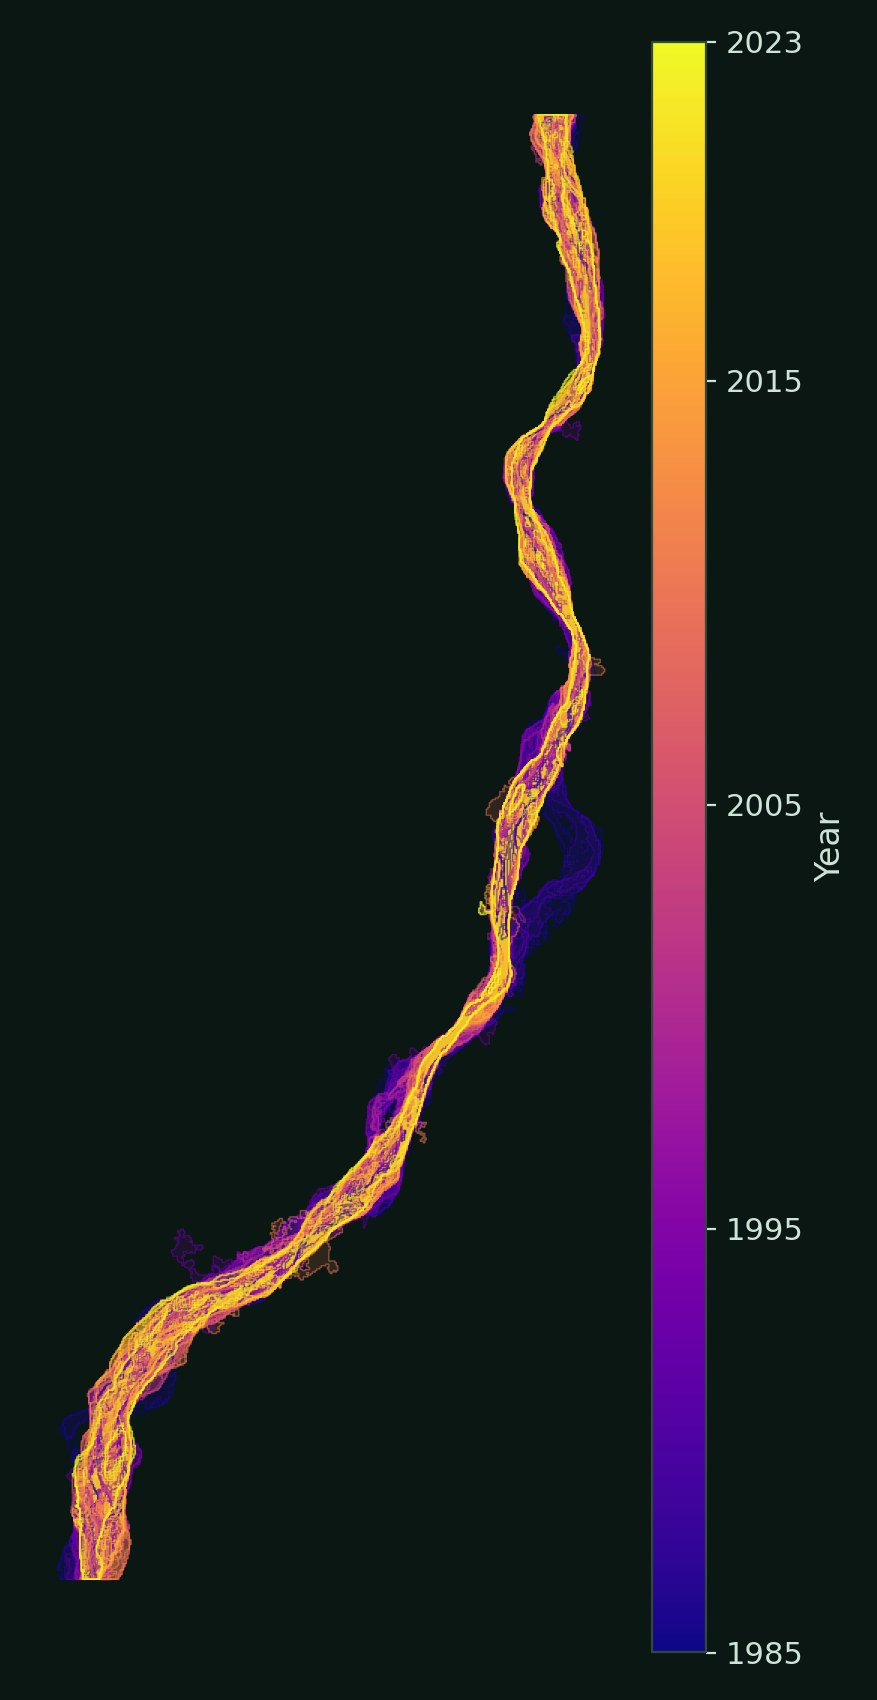
Every year of the Río Piraí channel from 1985 (deep purple) to 2023 (yellow), overlaid. The river braids and migrates across its floodplain while its wetted area steadily contracts.
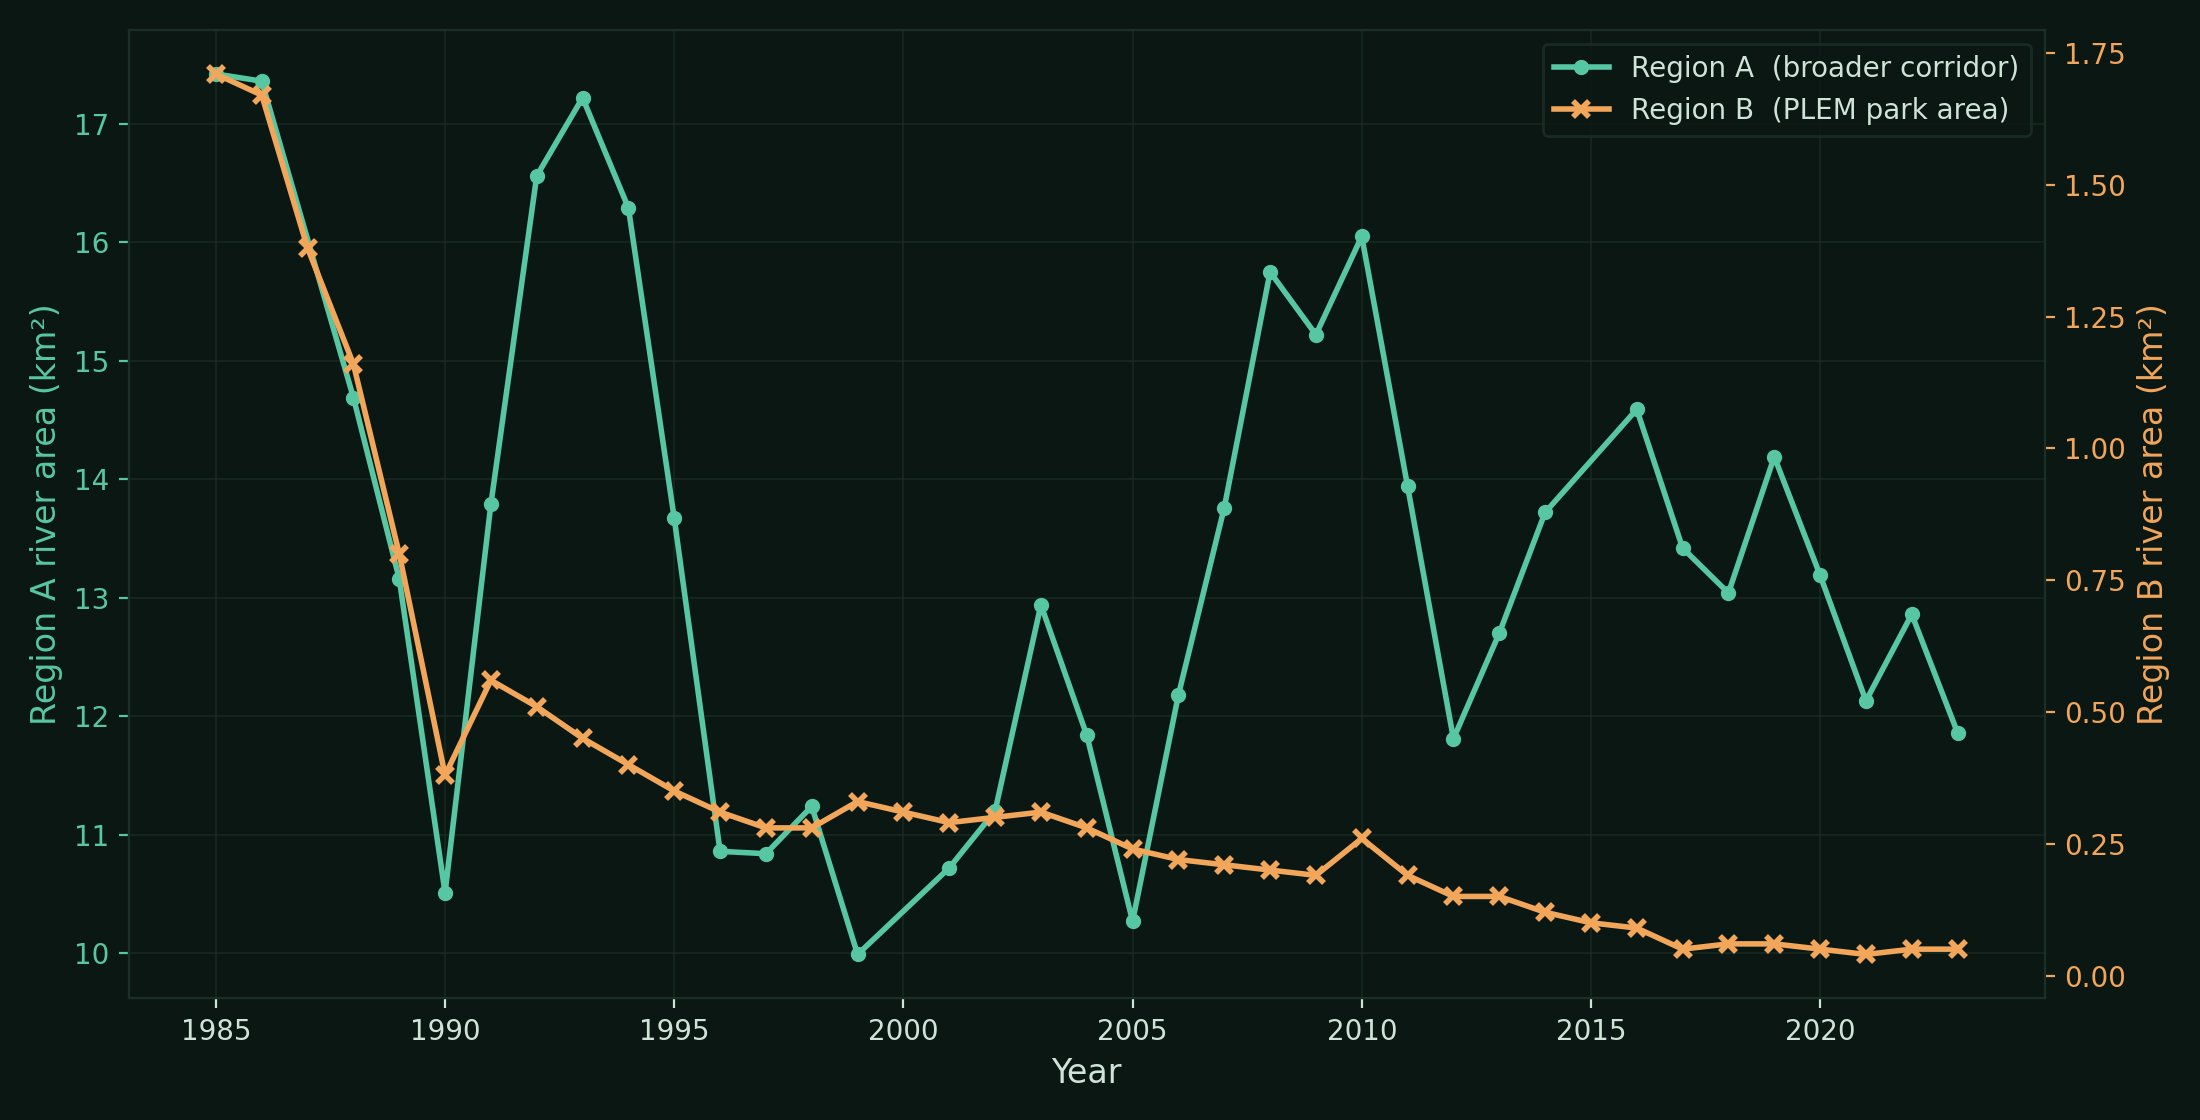
Río Piraí surface-water area, 1985–2023, for the wider corridor (Region A) and the park area itself (Region B). Both decline, but the park corridor collapses by roughly 97%.
The vegetation record tells the other half of the story: the biggest surges of forest growth line up exactly with the river abandoning old courses: the land the water leaves behind is where the forest returns.
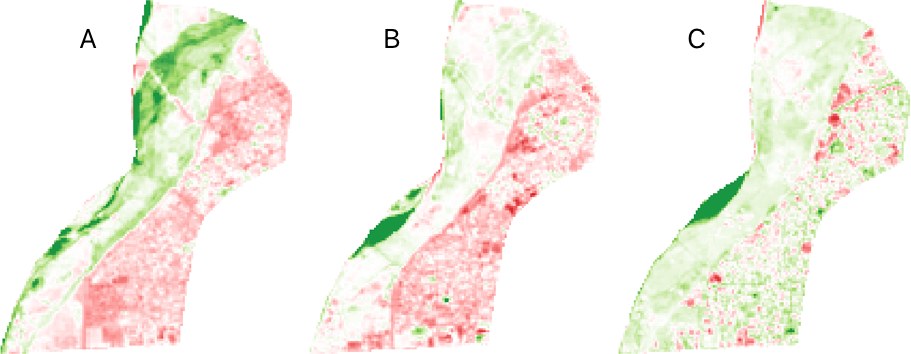
Per-pixel NDVI change between decades, 1985–2023. Green marks vegetation gain, red marks loss; the strongest greening traces the river's abandoned channels.
Together these layers give the park plan a factual footing: where the active channel actually is today versus where it was a generation ago, which stretches of floodplain forest are recovering and which are under pressure, and how far a major flood would reach into the proposed park and the streets behind it. It is the kind of baseline that turns a design intention, a park that lives with its river, into something you can plan against. And it keeps the river's own history in view: the Piraí has already shown, once, exactly how far it can reach.