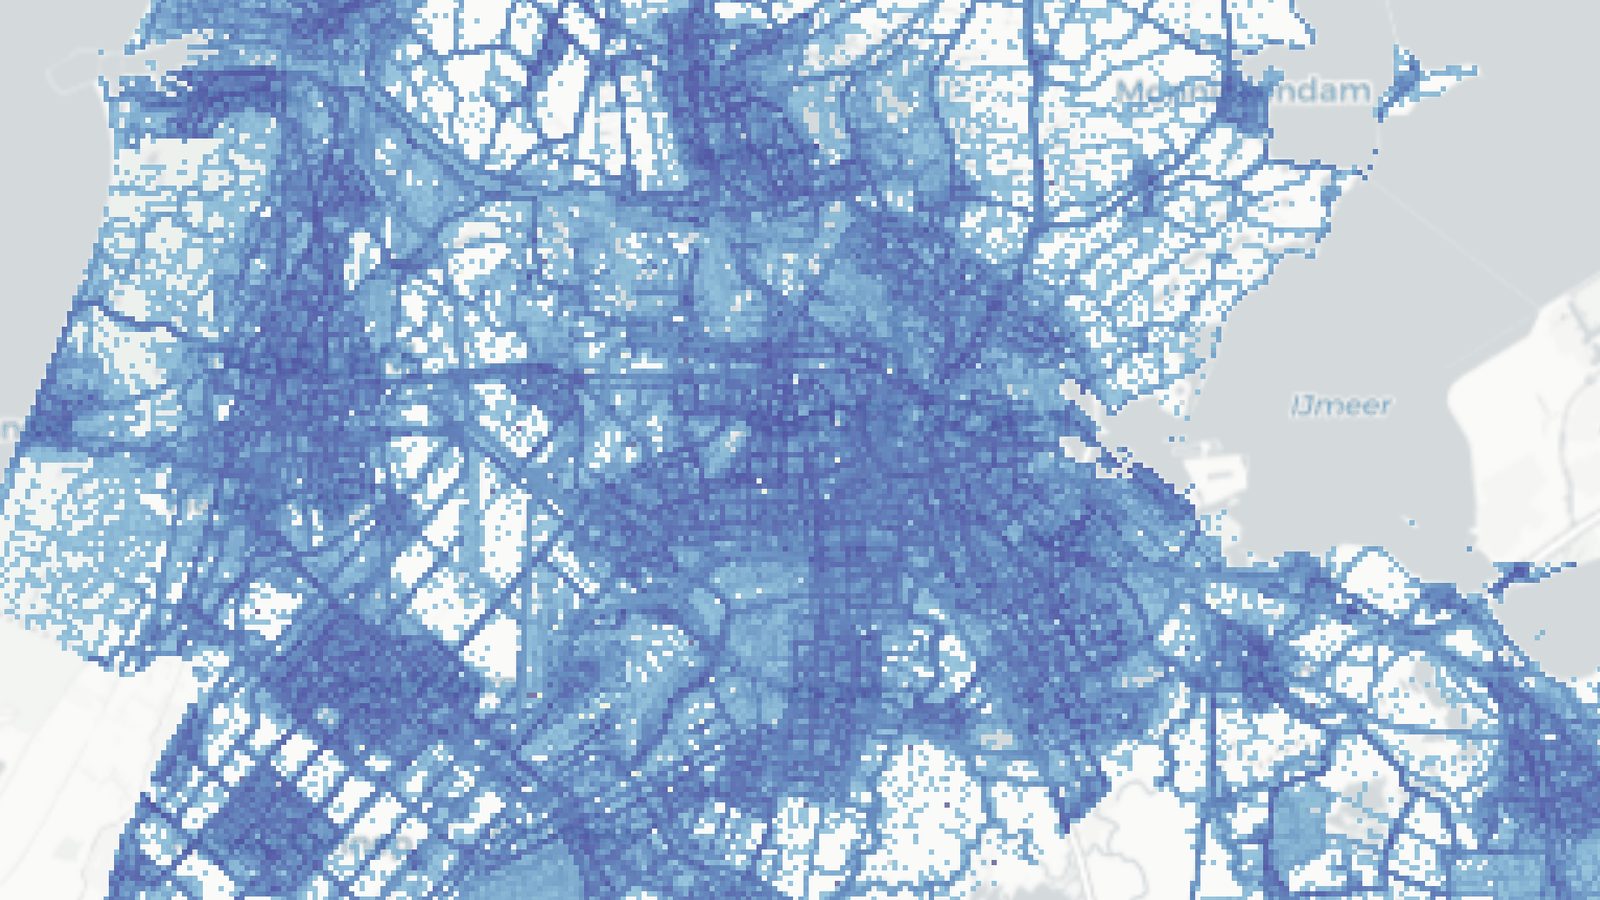
A single day of Amsterdam movement, resolved from raw GPS pings into mode-aware, street-level activity.
Turning 60 million raw phone-location pings into a mode-aware picture of how a city actually moves (on foot, by bike, by car) and how that shifts with the weather, the day, and the hour. The GNSS engine behind ORG's EU-funded Urban Movement Intelligence System.
A single day of Amsterdam movement, resolved from raw GPS pings into mode-aware, street-level activity.
Cities still commit billions to infrastructure and policy on the back of static, quickly outdated movement data. This includes data from methods such as travel surveys, spot counters or proxy metrics. Satellite-positioning data from smartphones offers a continuous, city-wide record of where people go, how they get there, and when, captured automatically, for a large share of the population.
UMIS, the Urban Movement Intelligence System, was ORG's EU-funded bet on that idea. I developed the idea with David Birge and co-wrote the grant that won SPACE4Cities backing; the goal of Phase 1 was to prove we could turn raw Galileo GNSS data into something a city could actually plan with.
The raw material is anonymized Galileo GNSS location data, supplied by Echo Analytics. A 10–30% daily sample of devices that is far richer than any survey. But raw pings are messy, they're sparse, noisy, and, as I found, 60% of the advertising IDs were shared across multiple people or devices, so a first step was partitioning IDs back into plausible individual users before anything else could be trusted.
I built the full processing engine end-to-end, in open-source Python:
trackintel framework.On the Amsterdam data that meant 60 million points → roughly 2 million trips across 736,000 devices, reconstructed end-to-end in about 35 minutes.
Fused with Copernicus environmental data, the reconstructed movement can be sliced by condition, this is the question the project was really about. The clearest example: comparing activity on a warm weekday, a hot weekday and a weekend shows how heat and day-type visibly redraw where and how a city moves.
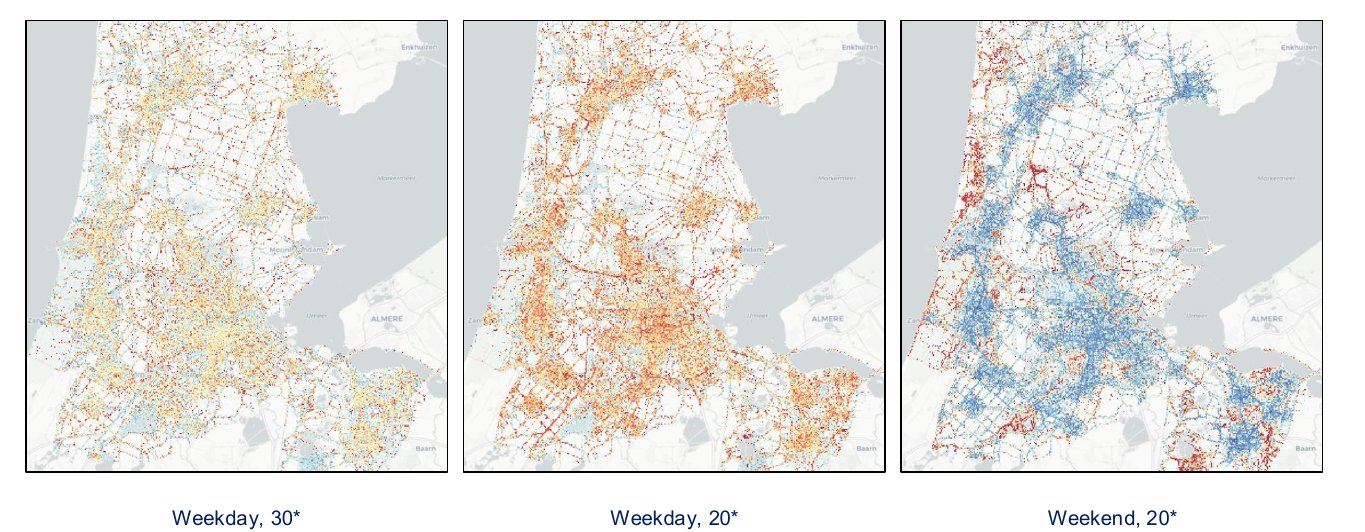
Movement redrawn by conditions: the same city on a hot weekday, a milder weekday and a weekend. Heat and day-type visibly shift where and how people move. (Amsterdam.)
The same engine produces street-level edge usage, grid density at two resolutions, and a 270,000-trip origin–destination matrix for zone-to-zone flows.
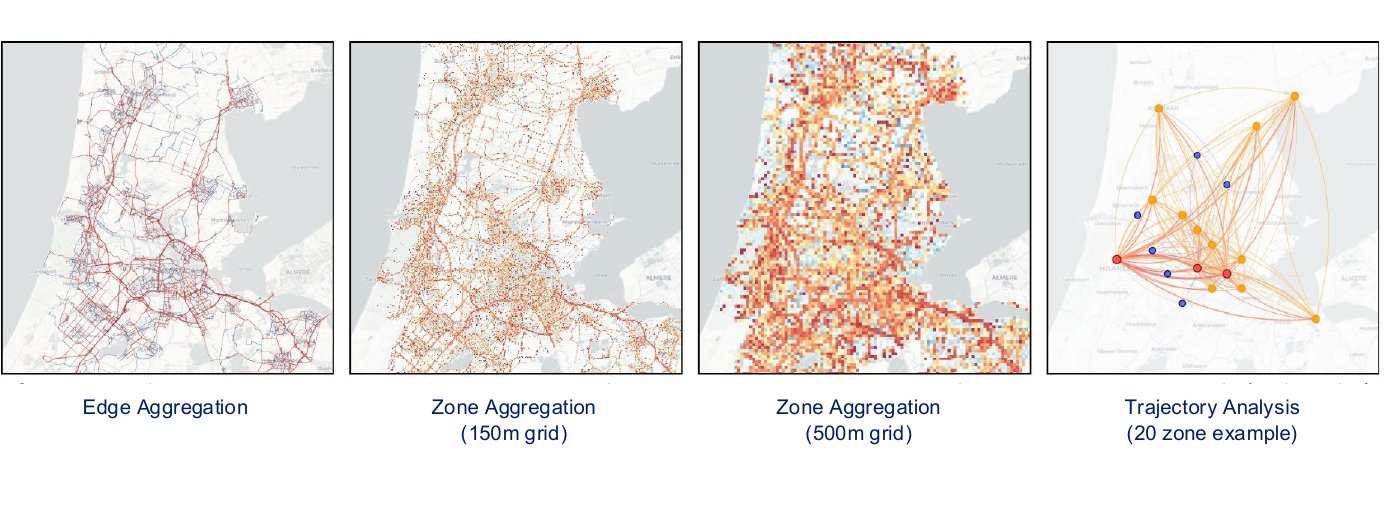
The four core datasets the engine produces from reconstructed trips: street-level edge usage, activity density at 150 m and 500 m grid resolutions, and zone-to-zone trajectory flows. (Driving activity, Amsterdam, 1.9.2023.)
Phase 1 was about building the capability and showing what it could surface; the analysis here is exploratory, not yet a formal statistical study.
The point of Phase 1 was to prove the engine, then map what it could support. With domain experts, we scored 15+ candidate urban-planning applications on novelty, impact, risk, and ROI. Two stood out: heat-vulnerability analysis, using a land-surface-temperature layer I'd begun downscaling on Google Earth Engine to find who is most exposed during extreme heat, and whose movement shrinks in it, and active-mobility opportunity, pinpointing where car trips could realistically shift to walking or cycling. Others ranged from special-event response to before-and-after infrastructure studies.
The project was shelved before any of these were built, and the city-facing website got only as far as design concepts. But the foundation holds, once a city's movement is reconstructed to this level, each of these becomes a question of analysis, not of new data collection.